Turkish Female Disability

COMPARE

Turkish
Race
Ancestry
AfghanAfricanAlaska NativeAlaskan AthabascanAlbanianAleutAlsatianAmericanApacheArabArapahoArgentineanArmenianAssyrian/Chaldean/SyriacAustralianAustrianBahamianBangladeshiBarbadianBasqueBelgianBelizeanBermudanBhutaneseBlackfeetBolivianBrazilianBritishBritish West IndianBulgarianBurmeseCajunCambodianCanadianCape VerdeanCarpatho RusynCelticCentral AmericanCentral American IndianCherokeeCheyenneChickasawChileanChineseChippewaChoctawColombianColvilleComancheCosta RicanCreeCreekCroatianCrowCubanCypriotCzechCzechoslovakianDanishDelawareDominicanDutchDutch West IndianEastern EuropeanEcuadorianEgyptianEnglishEstonianEthiopianEuropeanFijianFilipinoFinnishFrenchFrench American IndianFrench CanadianGermanGerman RussianGhanaianGreekGuamanian/ChamorroGuatemalanGuyaneseHaitianHmongHonduranHopiHoumaHungarianIcelanderIndian (Asian)IndonesianInupiatIranianIraqiIrishIroquoisIsraeliItalianJamaicanJapaneseJordanianKenyanKiowaKoreanLaotianLatvianLebaneseLiberianLithuanianLumbeeLuxembourgerMacedonianMalaysianMalteseMarshalleseMenomineeMexicanMexican American IndianMongolianMoroccanNative HawaiianNavajoNepaleseNew ZealanderNicaraguanNigerianNorthern EuropeanNorwegianOkinawanOsageOttawaPaiutePakistaniPalestinianPanamanianParaguayanPennsylvania GermanPeruvianPimaPolishPortuguesePotawatomiPuebloPuerto RicanPuget Sound SalishRomanianRussianSalvadoranSamoanScandinavianScotch-IrishScottishSeminoleSenegaleseSerbianShoshoneSierra LeoneanSiouxSlavicSlovakSloveneSomaliSouth AfricanSouth AmericanSouth American IndianSoviet UnionSpaniardSpanishSpanish AmericanSpanish American IndianSri LankanSubsaharan AfricanSudaneseSwedishSwissSyrianTaiwaneseThaiTlingit-HaidaTohono O'OdhamTonganTrinidadian and TobagonianTsimshianTurkishU.S. Virgin IslanderUgandanUkrainianUruguayanUteVenezuelanVietnameseWelshWest IndianYakamaYaquiYugoslavianYumanYup'ikZimbabwean
Immigration
NonimmigrantsImmigrantsAfghanistanAfricaAlbaniaArgentinaArmeniaAsiaAustraliaAustriaBahamasBangladeshBarbadosBelarusBelgiumBelizeBoliviaBosnia and HerzegovinaBrazilBulgariaBurma/MyanmarCabo VerdeCambodiaCameroonCanadaCaribbeanCentral AmericaChileChinaColombiaCongoCosta RicaCroatiaCubaCzechoslovakiaDenmarkDominicaDominican RepublicEastern AfricaEastern AsiaEastern EuropeEcuadorEgyptEl SalvadorEnglandEritreaEthiopiaEuropeFijiFranceGermanyGhanaGreeceGrenadaGuatemalaGuyanaHaitiHondurasHong KongHungaryIndiaIndonesiaIranIraqIrelandIsraelItalyJamaicaJapanJordanKazakhstanKenyaKoreaKuwaitLaosLatin AmericaLatviaLebanonLiberiaLithuaniaMalaysiaMexicoMicronesiaMiddle AfricaMoldovaMoroccoNepalNetherlandsNicaraguaNigeriaNorth AmericaNorth MacedoniaNorthern AfricaNorthern EuropeNorwayOceaniaPakistanPanamaPeruPhilippinesPolandPortugalRomaniaRussiaSaudi ArabiaScotlandSenegalSerbiaSierra LeoneSingaporeSomaliaSouth AfricaSouth AmericaSouth Central AsiaSouth Eastern AsiaSouthern EuropeSpainSri LankaSt. Vincent and the GrenadinesSudanSwedenSwitzerlandSyriaTaiwanThailandTrinidad and TobagoTurkeyUgandaUkraineUruguayUzbekistanVenezuelaVietnamWest IndiesWestern AfricaWestern AsiaWestern EuropeYemenZaireZimbabweAzores
Select to Compare
Race
Ancestry
AfghanAfricanAlaska NativeAlaskan AthabascanAlbanianAleutAlsatianAmericanApacheArabArapahoArgentineanArmenianAssyrian/Chaldean/SyriacAustralianAustrianBahamianBangladeshiBarbadianBasqueBelgianBelizeanBermudanBhutaneseBlackfeetBolivianBrazilianBritishBritish West IndianBulgarianBurmeseCajunCambodianCanadianCape VerdeanCarpatho RusynCelticCentral AmericanCentral American IndianCherokeeCheyenneChickasawChileanChineseChippewaChoctawColombianColvilleComancheCosta RicanCreeCreekCroatianCrowCubanCypriotCzechCzechoslovakianDanishDelawareDominicanDutchDutch West IndianEastern EuropeanEcuadorianEgyptianEnglishEstonianEthiopianEuropeanFijianFilipinoFinnishFrenchFrench American IndianFrench CanadianGermanGerman RussianGhanaianGreekGuamanian/ChamorroGuatemalanGuyaneseHaitianHmongHonduranHopiHoumaHungarianIcelanderIndian (Asian)IndonesianInupiatIranianIraqiIrishIroquoisIsraeliItalianJamaicanJapaneseJordanianKenyanKiowaKoreanLaotianLatvianLebaneseLiberianLithuanianLumbeeLuxembourgerMacedonianMalaysianMalteseMarshalleseMenomineeMexicanMexican American IndianMongolianMoroccanNative HawaiianNavajoNepaleseNew ZealanderNicaraguanNigerianNorthern EuropeanNorwegianOkinawanOsageOttawaPaiutePakistaniPalestinianPanamanianParaguayanPennsylvania GermanPeruvianPimaPolishPortuguesePotawatomiPuebloPuerto RicanPuget Sound SalishRomanianRussianSalvadoranSamoanScandinavianScotch-IrishScottishSeminoleSenegaleseSerbianShoshoneSierra LeoneanSiouxSlavicSlovakSloveneSomaliSouth AfricanSouth AmericanSouth American IndianSoviet UnionSpaniardSpanishSpanish AmericanSpanish American IndianSri LankanSubsaharan AfricanSudaneseSwedishSwissSyrianTaiwaneseThaiTlingit-HaidaTohono O'OdhamTonganTrinidadian and TobagonianTsimshianU.S. Virgin IslanderUgandanUkrainianUruguayanUteVenezuelanVietnameseWelshWest IndianYakamaYaquiYugoslavianYumanYup'ikZimbabwean
Immigration
NonimmigrantsImmigrantsAfghanistanAfricaAlbaniaArgentinaArmeniaAsiaAustraliaAustriaBahamasBangladeshBarbadosBelarusBelgiumBelizeBoliviaBosnia and HerzegovinaBrazilBulgariaBurma/MyanmarCabo VerdeCambodiaCameroonCanadaCaribbeanCentral AmericaChileChinaColombiaCongoCosta RicaCroatiaCubaCzechoslovakiaDenmarkDominicaDominican RepublicEastern AfricaEastern AsiaEastern EuropeEcuadorEgyptEl SalvadorEnglandEritreaEthiopiaEuropeFijiFranceGermanyGhanaGreeceGrenadaGuatemalaGuyanaHaitiHondurasHong KongHungaryIndiaIndonesiaIranIraqIrelandIsraelItalyJamaicaJapanJordanKazakhstanKenyaKoreaKuwaitLaosLatin AmericaLatviaLebanonLiberiaLithuaniaMalaysiaMexicoMicronesiaMiddle AfricaMoldovaMoroccoNepalNetherlandsNicaraguaNigeriaNorth AmericaNorth MacedoniaNorthern AfricaNorthern EuropeNorwayOceaniaPakistanPanamaPeruPhilippinesPolandPortugalRomaniaRussiaSaudi ArabiaScotlandSenegalSerbiaSierra LeoneSingaporeSomaliaSouth AfricaSouth AmericaSouth Central AsiaSouth Eastern AsiaSouthern EuropeSpainSri LankaSt. Vincent and the GrenadinesSudanSwedenSwitzerlandSyriaTaiwanThailandTrinidad and TobagoTurkeyUgandaUkraineUruguayUzbekistanVenezuelaVietnamWest IndiesWestern AfricaWestern AsiaWestern EuropeYemenZaireZimbabweAzores
Female Disability
Income
Poverty
Unemployment
Labor Participation
Family Structure
Vehicle Availability
Education Level
Disability

Turkish Female Disability
Exceptional

11.1%
DISABILITY | FEMALES
100.0/ 100
METRIC RATING
30th/ 347
METRIC RANK

Turkish Female Disability Correlation Chart

The statistical analysis conducted on geographies consisting of 271,848,470 people shows a mild positive correlation between the proportion of Turks and percentage of females with a disability in the United States with a correlation coefficient (R) of 0.338 and weighted average of 11.1%. On average, for every 1% (one percent) increase in Turks within a typical geography, there is an increase of 0.48% in percentage of females with a disability.
Turkish Female Disability
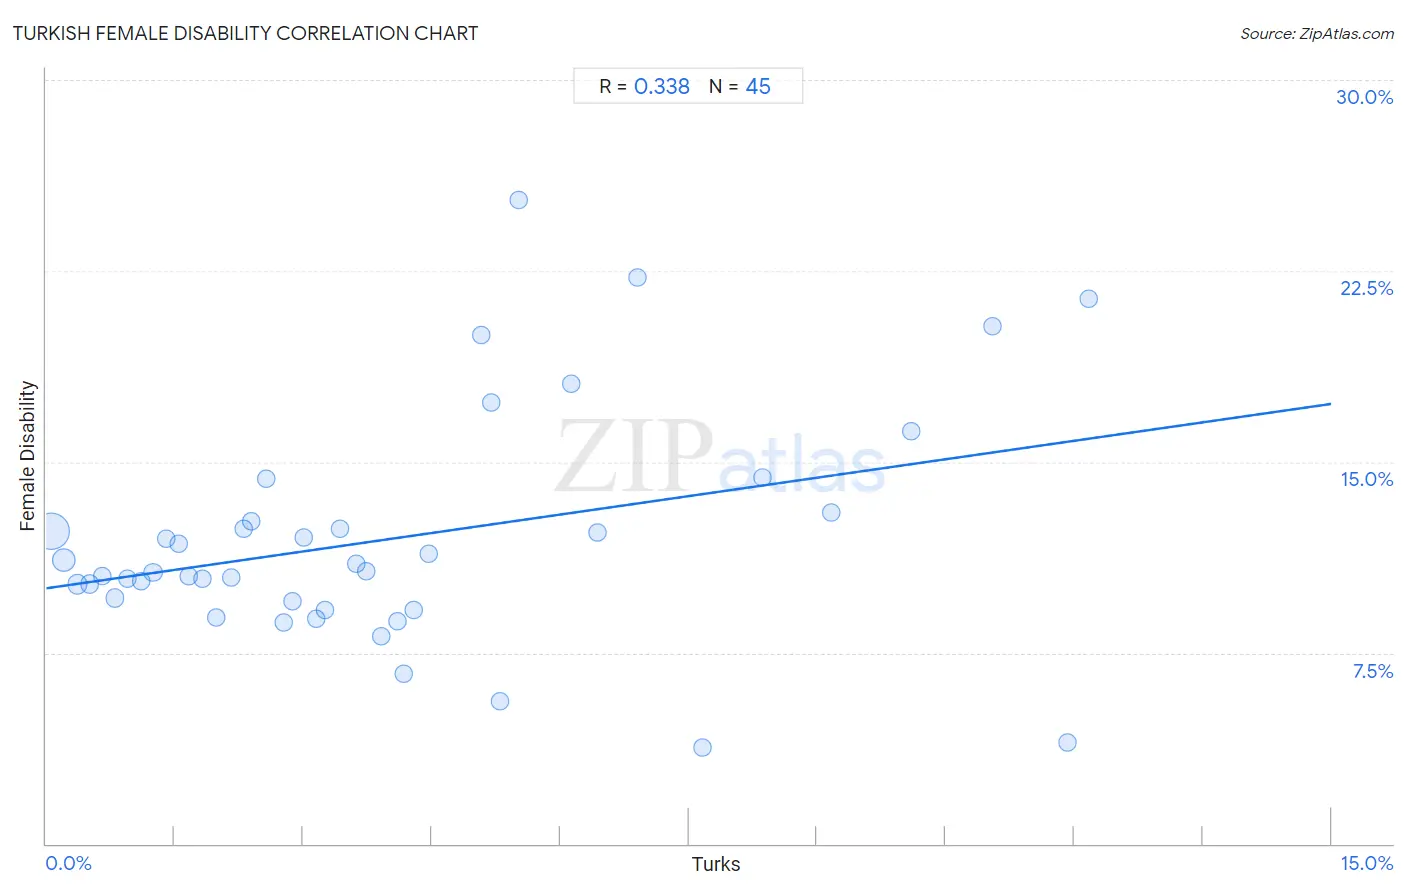
It is essential to understand that the correlation between the percentage of Turks and percentage of females with a disability does not imply a direct cause-and-effect relationship. It remains uncertain whether the presence of Turks influences an upward or downward trend in the level of percentage of females with a disability within an area, or if Turks simply ended up residing in those areas with higher or lower levels of percentage of females with a disability due to other factors.

Demographics Similar to Turks by Female Disability

In terms of female disability, the demographic groups most similar to Turks are Immigrants from Malaysia (11.1%, a difference of 0.0%), Egyptian (11.1%, a difference of 0.070%), Immigrants from Kuwait (11.1%, a difference of 0.10%), Immigrants from Australia (11.1%, a difference of 0.27%), and Immigrants from Turkey (11.1%, a difference of 0.34%).
DemographicsRating | RankFemale Disability
Venezuelans
100.0
/100
|
#23
Exceptional
11.0%
Immigrants from Argentina
100.0
/100
|
#24
Exceptional
11.0%
Immigrants from Asia
100.0
/100
|
#25
Exceptional
11.0%
Argentineans
100.0
/100
|
#26
Exceptional
11.0%
Immigrants from Turkey
100.0
/100
|
#27
Exceptional
11.1%
Egyptians
100.0
/100
|
#28
Exceptional
11.1%
Immigrants from Malaysia
100.0
/100
|
#29
Exceptional
11.1%
Turks
100.0
/100
|
#30
Exceptional
11.1%
Immigrants from Kuwait
100.0
/100
|
#31
Exceptional
11.1%
Immigrants from Australia
100.0
/100
|
#32
Exceptional
11.1%
Immigrants from Egypt
100.0
/100
|
#33
Exceptional
11.1%
Immigrants from Indonesia
100.0
/100
|
#34
Exceptional
11.2%
Immigrants from Japan
100.0
/100
|
#35
Exceptional
11.2%
Cypriots
100.0
/100
|
#36
Exceptional
11.2%
Ethiopians
100.0
/100
|
#37
Exceptional
11.2%

Turkish Female Disability Correlation Summary

MeasurementTurkish DataFemale Disability Data
Minimum0.061%3.8%
Maximum12.2%25.3%
Range12.1%21.5%
Mean4.0%12.0%
Median3.2%10.7%
Interquartile 25% (IQ1)1.6%9.4%
Interquartile 75% (IQ3)5.4%12.8%
Interquartile Range (IQR)3.8%3.5%
Standard Deviation (Sample)3.2%4.5%
Standard Deviation (Population)3.2%4.5%

Correlation Details

Turkish PercentileSample SizeFemale Disability
[
0.0%
-
0.5%
]
0.061%
189,249,66912.3%
[
0.0%
-
0.5%
]
0.20%
49,237,31011.1%
[
0.0%
-
0.5%
]
0.36%
14,871,96510.2%
[
0.5%
-
1.0%
]
0.51%
7,039,74610.2%
[
0.5%
-
1.0%
]
0.65%
3,926,51410.5%
[
0.5%
-
1.0%
]
0.80%
2,298,8339.7%
[
0.5%
-
1.0%
]
0.94%
1,523,45910.4%
[
1.0%
-
1.5%
]
1.11%
754,31410.3%
[
1.0%
-
1.5%
]
1.25%
612,68010.6%
[
1.0%
-
1.5%
]
1.40%
451,62112.0%
[
1.5%
-
2.0%
]
1.54%
542,50611.8%
[
1.5%
-
2.0%
]
1.66%
261,79710.5%
[
1.5%
-
2.0%
]
1.83%
294,86810.4%
[
1.5%
-
2.0%
]
1.98%
147,7138.9%
[
2.0%
-
2.5%
]
2.16%
97,19710.5%
[
2.0%
-
2.5%
]
2.31%
67,36512.4%
[
2.0%
-
2.5%
]
2.40%
61,94212.7%
[
2.5%
-
3.0%
]
2.56%
49,49014.3%
[
2.5%
-
3.0%
]
2.77%
33,5488.7%
[
2.5%
-
3.0%
]
2.88%
54,2879.5%
[
3.0%
-
3.5%
]
3.01%
52,38912.0%
[
3.0%
-
3.5%
]
3.16%
3,6118.8%
[
3.0%
-
3.5%
]
3.25%
17,3409.2%
[
3.0%
-
3.5%
]
3.42%
1,31412.4%
[
3.5%
-
4.0%
]
3.62%
33,60911.0%
[
3.5%
-
4.0%
]
3.73%
31,64810.7%
[
3.5%
-
4.0%
]
3.90%
13,3948.1%
[
4.0%
-
4.5%
]
4.10%
11,6238.7%
[
4.0%
-
4.5%
]
4.18%
26,8296.7%
[
4.0%
-
4.5%
]
4.28%
18,0679.2%
[
4.0%
-
4.5%
]
4.47%
10,89711.4%
[
5.0%
-
5.5%
]
5.08%
5920.0%
[
5.0%
-
5.5%
]
5.19%
1,46317.4%
[
5.0%
-
5.5%
]
5.30%
4345.6%
[
5.5%
-
6.0%
]
5.51%
38125.3%
[
6.0%
-
6.5%
]
6.13%
1,61618.1%
[
6.0%
-
6.5%
]
6.44%
21,95012.2%
[
6.5%
-
7.0%
]
6.90%
2922.2%
[
7.5%
-
8.0%
]
7.66%
4,1503.8%
[
8.0%
-
8.5%
]
8.36%
11,45814.4%
[
9.0%
-
9.5%
]
9.17%
1,66913.0%
[
10.0%
-
10.5%
]
10.10%
5,47616.2%
[
11.0%
-
11.5%
]
11.04%
1,85720.3%
[
11.5%
-
12.0%
]
11.91%
2354.0%
[
12.0%
-
12.5%
]
12.16%
14821.4%