Chinese Female Disability

COMPARE

Chinese
Race
Ancestry
AfghanAfricanAlaska NativeAlaskan AthabascanAlbanianAleutAlsatianAmericanApacheArabArapahoArgentineanArmenianAssyrian/Chaldean/SyriacAustralianAustrianBahamianBangladeshiBarbadianBasqueBelgianBelizeanBermudanBhutaneseBlackfeetBolivianBrazilianBritishBritish West IndianBulgarianBurmeseCajunCambodianCanadianCape VerdeanCarpatho RusynCelticCentral AmericanCentral American IndianCherokeeCheyenneChickasawChileanChineseChippewaChoctawColombianColvilleComancheCosta RicanCreeCreekCroatianCrowCubanCypriotCzechCzechoslovakianDanishDelawareDominicanDutchDutch West IndianEastern EuropeanEcuadorianEgyptianEnglishEstonianEthiopianEuropeanFijianFilipinoFinnishFrenchFrench American IndianFrench CanadianGermanGerman RussianGhanaianGreekGuamanian/ChamorroGuatemalanGuyaneseHaitianHmongHonduranHopiHoumaHungarianIcelanderIndian (Asian)IndonesianInupiatIranianIraqiIrishIroquoisIsraeliItalianJamaicanJapaneseJordanianKenyanKiowaKoreanLaotianLatvianLebaneseLiberianLithuanianLumbeeLuxembourgerMacedonianMalaysianMalteseMarshalleseMenomineeMexicanMexican American IndianMongolianMoroccanNative HawaiianNavajoNepaleseNew ZealanderNicaraguanNigerianNorthern EuropeanNorwegianOkinawanOsageOttawaPaiutePakistaniPalestinianPanamanianParaguayanPennsylvania GermanPeruvianPimaPolishPortuguesePotawatomiPuebloPuerto RicanPuget Sound SalishRomanianRussianSalvadoranSamoanScandinavianScotch-IrishScottishSeminoleSenegaleseSerbianShoshoneSierra LeoneanSiouxSlavicSlovakSloveneSomaliSouth AfricanSouth AmericanSouth American IndianSoviet UnionSpaniardSpanishSpanish AmericanSpanish American IndianSri LankanSubsaharan AfricanSudaneseSwedishSwissSyrianTaiwaneseThaiTlingit-HaidaTohono O'OdhamTonganTrinidadian and TobagonianTsimshianTurkishU.S. Virgin IslanderUgandanUkrainianUruguayanUteVenezuelanVietnameseWelshWest IndianYakamaYaquiYugoslavianYumanYup'ikZimbabwean
Immigration
NonimmigrantsImmigrantsAfghanistanAfricaAlbaniaArgentinaArmeniaAsiaAustraliaAustriaBahamasBangladeshBarbadosBelarusBelgiumBelizeBoliviaBosnia and HerzegovinaBrazilBulgariaBurma/MyanmarCabo VerdeCambodiaCameroonCanadaCaribbeanCentral AmericaChileChinaColombiaCongoCosta RicaCroatiaCubaCzechoslovakiaDenmarkDominicaDominican RepublicEastern AfricaEastern AsiaEastern EuropeEcuadorEgyptEl SalvadorEnglandEritreaEthiopiaEuropeFijiFranceGermanyGhanaGreeceGrenadaGuatemalaGuyanaHaitiHondurasHong KongHungaryIndiaIndonesiaIranIraqIrelandIsraelItalyJamaicaJapanJordanKazakhstanKenyaKoreaKuwaitLaosLatin AmericaLatviaLebanonLiberiaLithuaniaMalaysiaMexicoMicronesiaMiddle AfricaMoldovaMoroccoNepalNetherlandsNicaraguaNigeriaNorth AmericaNorth MacedoniaNorthern AfricaNorthern EuropeNorwayOceaniaPakistanPanamaPeruPhilippinesPolandPortugalRomaniaRussiaSaudi ArabiaScotlandSenegalSerbiaSierra LeoneSingaporeSomaliaSouth AfricaSouth AmericaSouth Central AsiaSouth Eastern AsiaSouthern EuropeSpainSri LankaSt. Vincent and the GrenadinesSudanSwedenSwitzerlandSyriaTaiwanThailandTrinidad and TobagoTurkeyUgandaUkraineUruguayUzbekistanVenezuelaVietnamWest IndiesWestern AfricaWestern AsiaWestern EuropeYemenZaireZimbabweAzores
Select to Compare
Race
Ancestry
AfghanAfricanAlaska NativeAlaskan AthabascanAlbanianAleutAlsatianAmericanApacheArabArapahoArgentineanArmenianAssyrian/Chaldean/SyriacAustralianAustrianBahamianBangladeshiBarbadianBasqueBelgianBelizeanBermudanBhutaneseBlackfeetBolivianBrazilianBritishBritish West IndianBulgarianBurmeseCajunCambodianCanadianCape VerdeanCarpatho RusynCelticCentral AmericanCentral American IndianCherokeeCheyenneChickasawChileanChippewaChoctawColombianColvilleComancheCosta RicanCreeCreekCroatianCrowCubanCypriotCzechCzechoslovakianDanishDelawareDominicanDutchDutch West IndianEastern EuropeanEcuadorianEgyptianEnglishEstonianEthiopianEuropeanFijianFilipinoFinnishFrenchFrench American IndianFrench CanadianGermanGerman RussianGhanaianGreekGuamanian/ChamorroGuatemalanGuyaneseHaitianHmongHonduranHopiHoumaHungarianIcelanderIndian (Asian)IndonesianInupiatIranianIraqiIrishIroquoisIsraeliItalianJamaicanJapaneseJordanianKenyanKiowaKoreanLaotianLatvianLebaneseLiberianLithuanianLumbeeLuxembourgerMacedonianMalaysianMalteseMarshalleseMenomineeMexicanMexican American IndianMongolianMoroccanNative HawaiianNavajoNepaleseNew ZealanderNicaraguanNigerianNorthern EuropeanNorwegianOkinawanOsageOttawaPaiutePakistaniPalestinianPanamanianParaguayanPennsylvania GermanPeruvianPimaPolishPortuguesePotawatomiPuebloPuerto RicanPuget Sound SalishRomanianRussianSalvadoranSamoanScandinavianScotch-IrishScottishSeminoleSenegaleseSerbianShoshoneSierra LeoneanSiouxSlavicSlovakSloveneSomaliSouth AfricanSouth AmericanSouth American IndianSoviet UnionSpaniardSpanishSpanish AmericanSpanish American IndianSri LankanSubsaharan AfricanSudaneseSwedishSwissSyrianTaiwaneseThaiTlingit-HaidaTohono O'OdhamTonganTrinidadian and TobagonianTsimshianTurkishU.S. Virgin IslanderUgandanUkrainianUruguayanUteVenezuelanVietnameseWelshWest IndianYakamaYaquiYugoslavianYumanYup'ikZimbabwean
Immigration
NonimmigrantsImmigrantsAfghanistanAfricaAlbaniaArgentinaArmeniaAsiaAustraliaAustriaBahamasBangladeshBarbadosBelarusBelgiumBelizeBoliviaBosnia and HerzegovinaBrazilBulgariaBurma/MyanmarCabo VerdeCambodiaCameroonCanadaCaribbeanCentral AmericaChileChinaColombiaCongoCosta RicaCroatiaCubaCzechoslovakiaDenmarkDominicaDominican RepublicEastern AfricaEastern AsiaEastern EuropeEcuadorEgyptEl SalvadorEnglandEritreaEthiopiaEuropeFijiFranceGermanyGhanaGreeceGrenadaGuatemalaGuyanaHaitiHondurasHong KongHungaryIndiaIndonesiaIranIraqIrelandIsraelItalyJamaicaJapanJordanKazakhstanKenyaKoreaKuwaitLaosLatin AmericaLatviaLebanonLiberiaLithuaniaMalaysiaMexicoMicronesiaMiddle AfricaMoldovaMoroccoNepalNetherlandsNicaraguaNigeriaNorth AmericaNorth MacedoniaNorthern AfricaNorthern EuropeNorwayOceaniaPakistanPanamaPeruPhilippinesPolandPortugalRomaniaRussiaSaudi ArabiaScotlandSenegalSerbiaSierra LeoneSingaporeSomaliaSouth AfricaSouth AmericaSouth Central AsiaSouth Eastern AsiaSouthern EuropeSpainSri LankaSt. Vincent and the GrenadinesSudanSwedenSwitzerlandSyriaTaiwanThailandTrinidad and TobagoTurkeyUgandaUkraineUruguayUzbekistanVenezuelaVietnamWest IndiesWestern AfricaWestern AsiaWestern EuropeYemenZaireZimbabweAzores
Female Disability
Income
Poverty
Unemployment
Labor Participation
Family Structure
Vehicle Availability
Education Level
Disability

Chinese Female Disability
Fair

12.3%
DISABILITY | FEMALES
22.1/ 100
METRIC RATING
201st/ 347
METRIC RANK

Chinese Female Disability Correlation Chart

The statistical analysis conducted on geographies consisting of 64,802,500 people shows a weak positive correlation between the proportion of Chinese and percentage of females with a disability in the United States with a correlation coefficient (R) of 0.201 and weighted average of 12.3%. On average, for every 1% (one percent) increase in Chinese within a typical geography, there is an increase of 0.52% in percentage of females with a disability.
Chinese Female Disability
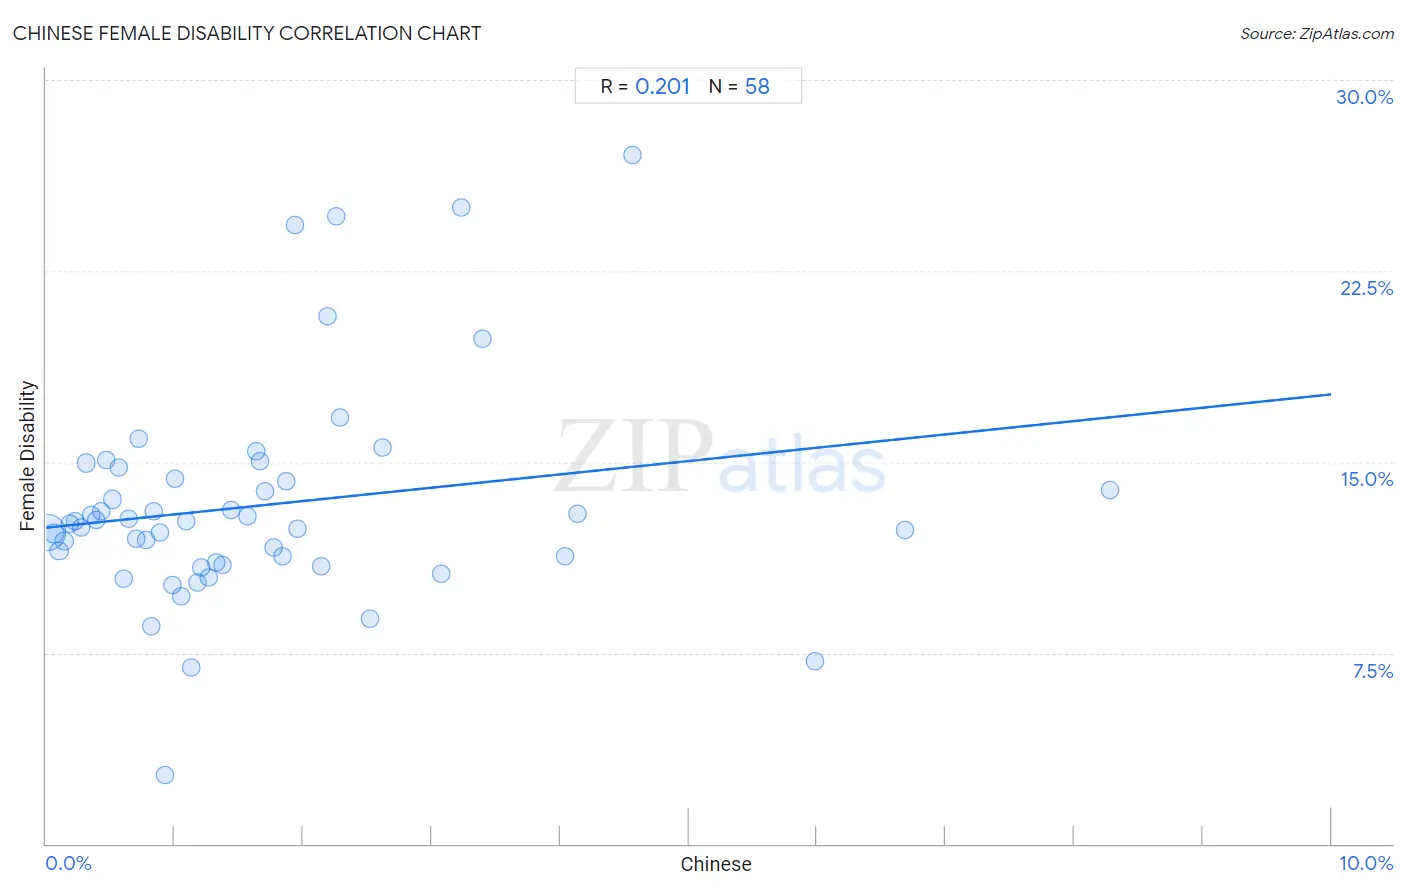
It is essential to understand that the correlation between the percentage of Chinese and percentage of females with a disability does not imply a direct cause-and-effect relationship. It remains uncertain whether the presence of Chinese influences an upward or downward trend in the level of percentage of females with a disability within an area, or if Chinese simply ended up residing in those areas with higher or lower levels of percentage of females with a disability due to other factors.

Demographics Similar to Chinese by Female Disability

In terms of female disability, the demographic groups most similar to Chinese are Trinidadian and Tobagonian (12.3%, a difference of 0.010%), Somali (12.3%, a difference of 0.030%), Immigrants from Barbados (12.3%, a difference of 0.050%), Immigrants from Zaire (12.3%, a difference of 0.070%), and Immigrants from Grenada (12.4%, a difference of 0.090%).
DemographicsRating | RankFemale Disability
Ukrainians
27.2
/100
|
#194
Fair
12.3%
Swedes
26.6
/100
|
#195
Fair
12.3%
Immigrants from Panama
25.5
/100
|
#196
Fair
12.3%
Hondurans
25.4
/100
|
#197
Fair
12.3%
Mexican American Indians
24.9
/100
|
#198
Fair
12.3%
Immigrants from Trinidad and Tobago
24.7
/100
|
#199
Fair
12.3%
Trinidadians and Tobagonians
22.4
/100
|
#200
Fair
12.3%
Chinese
22.1
/100
|
#201
Fair
12.3%
Somalis
21.5
/100
|
#202
Fair
12.3%
Immigrants from Barbados
21.1
/100
|
#203
Fair
12.3%
Immigrants from Zaire
20.9
/100
|
#204
Fair
12.3%
Immigrants from Grenada
20.5
/100
|
#205
Fair
12.4%
Immigrants from Cuba
20.2
/100
|
#206
Fair
12.4%
Croatians
20.2
/100
|
#207
Fair
12.4%
Basques
17.5
/100
|
#208
Poor
12.4%

Chinese Female Disability Correlation Summary

MeasurementChinese DataFemale Disability Data
Minimum0.0087%2.7%
Maximum8.3%27.1%
Range8.3%24.4%
Mean1.7%13.3%
Median1.2%12.6%
Interquartile 25% (IQ1)0.60%11.1%
Interquartile 75% (IQ3)2.1%14.3%
Interquartile Range (IQR)1.5%3.3%
Standard Deviation (Sample)1.7%4.3%
Standard Deviation (Population)1.6%4.3%

Correlation Details

Chinese PercentileSample SizeFemale Disability
[
0.0%
-
0.5%
]
0.0087%
53,055,74612.2%
[
0.0%
-
0.5%
]
0.059%
5,049,04312.2%
[
0.0%
-
0.5%
]
0.10%
1,538,21011.5%
[
0.0%
-
0.5%
]
0.14%
1,149,26611.9%
[
0.0%
-
0.5%
]
0.19%
529,05112.6%
[
0.0%
-
0.5%
]
0.22%
242,51912.7%
[
0.0%
-
0.5%
]
0.27%
241,73912.4%
[
0.0%
-
0.5%
]
0.31%
264,41015.0%
[
0.0%
-
0.5%
]
0.35%
172,81312.9%
[
0.0%
-
0.5%
]
0.39%
107,01612.7%
[
0.0%
-
0.5%
]
0.43%
144,77913.1%
[
0.0%
-
0.5%
]
0.47%
76,39515.1%
[
0.5%
-
1.0%
]
0.52%
117,21913.5%
[
0.5%
-
1.0%
]
0.56%
79,97814.8%
[
0.5%
-
1.0%
]
0.60%
263,90410.4%
[
0.5%
-
1.0%
]
0.64%
104,38312.8%
[
0.5%
-
1.0%
]
0.70%
114,48712.0%
[
0.5%
-
1.0%
]
0.72%
82,65615.9%
[
0.5%
-
1.0%
]
0.78%
454,77711.9%
[
0.5%
-
1.0%
]
0.82%
24,0958.5%
[
0.5%
-
1.0%
]
0.84%
151,35513.1%
[
0.5%
-
1.0%
]
0.89%
78,35412.2%
[
0.5%
-
1.0%
]
0.92%
7582.7%
[
0.5%
-
1.0%
]
0.98%
40,32310.2%
[
1.0%
-
1.5%
]
1.00%
54,18214.3%
[
1.0%
-
1.5%
]
1.05%
13,2929.7%
[
1.0%
-
1.5%
]
1.09%
39,43712.6%
[
1.0%
-
1.5%
]
1.12%
22,8646.9%
[
1.0%
-
1.5%
]
1.17%
30,50810.3%
[
1.0%
-
1.5%
]
1.21%
77,41510.8%
[
1.0%
-
1.5%
]
1.27%
54,36210.5%
[
1.0%
-
1.5%
]
1.33%
27,73911.1%
[
1.0%
-
1.5%
]
1.37%
11,13810.9%
[
1.0%
-
1.5%
]
1.44%
50,14213.1%
[
1.5%
-
2.0%
]
1.57%
27,42312.9%
[
1.5%
-
2.0%
]
1.63%
45,39215.4%
[
1.5%
-
2.0%
]
1.67%
48,49415.0%
[
1.5%
-
2.0%
]
1.70%
18,80213.9%
[
1.5%
-
2.0%
]
1.77%
35,49311.6%
[
1.5%
-
2.0%
]
1.84%
41,56011.3%
[
1.5%
-
2.0%
]
1.87%
10,80114.2%
[
1.5%
-
2.0%
]
1.94%
46524.3%
[
1.5%
-
2.0%
]
1.95%
8,54312.4%
[
2.0%
-
2.5%
]
2.14%
63,43910.9%
[
2.0%
-
2.5%
]
2.19%
1,55520.7%
[
2.0%
-
2.5%
]
2.26%
1,50724.7%
[
2.0%
-
2.5%
]
2.28%
1,57616.8%
[
2.5%
-
3.0%
]
2.52%
1598.9%
[
2.5%
-
3.0%
]
2.61%
8,57115.5%
[
3.0%
-
3.5%
]
3.08%
13010.6%
[
3.0%
-
3.5%
]
3.23%
27925.0%
[
3.0%
-
3.5%
]
3.39%
3,62719.8%
[
4.0%
-
4.5%
]
4.04%
4,13511.3%
[
4.0%
-
4.5%
]
4.14%
9,57113.0%
[
4.5%
-
5.0%
]
4.56%
54827.1%
[
5.5%
-
6.0%
]
5.98%
5,0657.2%
[
6.5%
-
7.0%
]
6.68%
85312.3%
[
8.0%
-
8.5%
]
8.28%
15713.9%