Austrian Married-couple Households
COMPARE
Austrian
Select to Compare
Married-couple Households
Austrian Married-couple Households
48.6%
MARRIED-COUPLE HOUSEHOLDS
99.3/ 100
METRIC RATING
55th/ 347
METRIC RANK
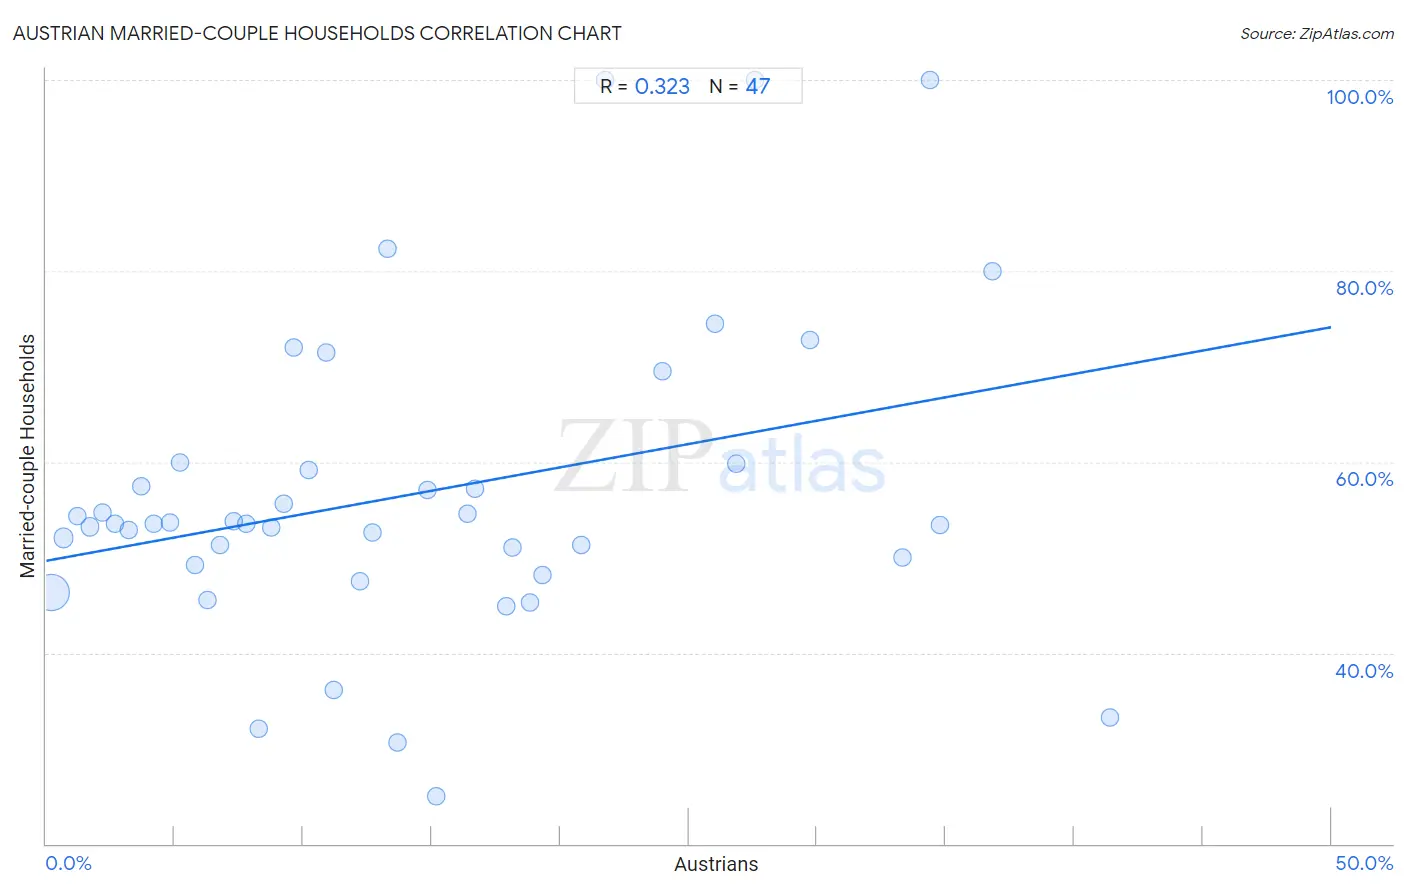
Austrian Married-couple Households Correlation Chart
The statistical analysis conducted on geographies consisting of 451,781,839 people shows a mild positive correlation between the proportion of Austrians and percentage of married-couple family households in the United States with a correlation coefficient (R) of 0.323 and weighted average of 48.6%. On average, for every 1% (one percent) increase in Austrians within a typical geography, there is an increase of 0.49% in percentage of married-couple family households.
It is essential to understand that the correlation between the percentage of Austrians and percentage of married-couple family households does not imply a direct cause-and-effect relationship. It remains uncertain whether the presence of Austrians influences an upward or downward trend in the level of percentage of married-couple family households within an area, or if Austrians simply ended up residing in those areas with higher or lower levels of percentage of married-couple family households due to other factors.
Demographics Similar to Austrians by Married-couple Households
In terms of married-couple households, the demographic groups most similar to Austrians are Immigrants from Northern Europe (48.6%, a difference of 0.0%), White/Caucasian (48.6%, a difference of 0.010%), Immigrants from Lithuania (48.6%, a difference of 0.010%), Irish (48.6%, a difference of 0.060%), and Polish (48.5%, a difference of 0.090%).
| Demographics | Rating | Rank | Married-couple Households |
| Indians (Asian) | 99.4 /100 | #48 | Exceptional 48.7% |
| Immigrants from Sri Lanka | 99.4 /100 | #49 | Exceptional 48.7% |
| Samoans | 99.4 /100 | #50 | Exceptional 48.7% |
| Eastern Europeans | 99.3 /100 | #51 | Exceptional 48.6% |
| Irish | 99.3 /100 | #52 | Exceptional 48.6% |
| Whites/Caucasians | 99.3 /100 | #53 | Exceptional 48.6% |
| Immigrants from Lithuania | 99.3 /100 | #54 | Exceptional 48.6% |
| Austrians | 99.3 /100 | #55 | Exceptional 48.6% |
| Immigrants from Northern Europe | 99.3 /100 | #56 | Exceptional 48.6% |
| Poles | 99.2 /100 | #57 | Exceptional 48.5% |
| Immigrants from Indonesia | 99.2 /100 | #58 | Exceptional 48.5% |
| Czechoslovakians | 99.2 /100 | #59 | Exceptional 48.5% |
| Croatians | 99.1 /100 | #60 | Exceptional 48.5% |
| Bulgarians | 99.1 /100 | #61 | Exceptional 48.5% |
| Luxembourgers | 99.1 /100 | #62 | Exceptional 48.5% |
Austrian Married-couple Households Correlation Summary
| Measurement | Austrian Data | Married-couple Households Data |
| Minimum | 0.17% | 25.0% |
| Maximum | 41.4% | 100.0% |
| Range | 41.2% | 75.0% |
| Mean | 14.4% | 56.7% |
| Median | 12.2% | 53.5% |
| Interquartile 25% (IQ1) | 5.8% | 49.2% |
| Interquartile 75% (IQ3) | 20.8% | 59.8% |
| Interquartile Range (IQR) | 15.0% | 10.6% |
| Standard Deviation (Sample) | 10.8% | 16.4% |
| Standard Deviation (Population) | 10.7% | 16.2% |
Correlation Details
| Austrian Percentile | Sample Size | Married-couple Households |
[ 0.0% - 0.5% ] 0.17% | 406,356,582 | 46.3% |
[ 0.5% - 1.0% ] 0.67% | 36,490,650 | 52.0% |
[ 1.0% - 1.5% ] 1.20% | 6,149,339 | 54.3% |
[ 1.5% - 2.0% ] 1.70% | 1,579,824 | 53.2% |
[ 2.0% - 2.5% ] 2.20% | 471,038 | 54.7% |
[ 2.5% - 3.0% ] 2.70% | 274,762 | 53.5% |
[ 3.0% - 3.5% ] 3.20% | 143,697 | 52.8% |
[ 3.5% - 4.0% ] 3.71% | 106,131 | 57.5% |
[ 4.0% - 4.5% ] 4.18% | 73,997 | 53.5% |
[ 4.5% - 5.0% ] 4.79% | 28,779 | 53.7% |
[ 5.0% - 5.5% ] 5.23% | 18,941 | 59.9% |
[ 5.5% - 6.0% ] 5.77% | 12,235 | 49.2% |
[ 6.0% - 6.5% ] 6.26% | 13,875 | 45.6% |
[ 6.5% - 7.0% ] 6.74% | 7,981 | 51.3% |
[ 7.0% - 7.5% ] 7.28% | 10,681 | 53.8% |
[ 7.5% - 8.0% ] 7.78% | 7,978 | 53.5% |
[ 8.0% - 8.5% ] 8.27% | 1,294 | 32.0% |
[ 8.5% - 9.0% ] 8.78% | 3,418 | 53.1% |
[ 9.0% - 9.5% ] 9.26% | 1,491 | 55.6% |
[ 9.5% - 10.0% ] 9.63% | 4,322 | 72.0% |
[ 10.0% - 10.5% ] 10.20% | 3,842 | 59.2% |
[ 10.5% - 11.0% ] 10.89% | 3,765 | 71.5% |
[ 11.0% - 11.5% ] 11.19% | 1,171 | 36.2% |
[ 12.0% - 12.5% ] 12.22% | 1,056 | 47.5% |
[ 12.5% - 13.0% ] 12.68% | 5,993 | 52.7% |
[ 13.0% - 13.5% ] 13.28% | 580 | 82.4% |
[ 13.5% - 14.0% ] 13.68% | 117 | 30.7% |
[ 14.5% - 15.0% ] 14.84% | 1,294 | 57.1% |
[ 15.0% - 15.5% ] 15.15% | 99 | 25.0% |
[ 16.0% - 16.5% ] 16.38% | 2,802 | 54.5% |
[ 16.5% - 17.0% ] 16.67% | 12 | 57.1% |
[ 17.5% - 18.0% ] 17.88% | 179 | 44.9% |
[ 18.0% - 18.5% ] 18.14% | 397 | 51.1% |
[ 18.5% - 19.0% ] 18.83% | 377 | 45.3% |
[ 19.0% - 19.5% ] 19.33% | 507 | 48.2% |
[ 20.5% - 21.0% ] 20.81% | 620 | 51.3% |
[ 21.5% - 22.0% ] 21.74% | 46 | 100.0% |
[ 23.5% - 24.0% ] 23.95% | 526 | 69.5% |
[ 26.0% - 26.5% ] 26.04% | 192 | 74.5% |
[ 26.5% - 27.0% ] 26.84% | 652 | 59.8% |
[ 27.5% - 28.0% ] 27.59% | 29 | 100.0% |
[ 29.5% - 30.0% ] 29.70% | 101 | 72.7% |
[ 33.0% - 33.5% ] 33.33% | 108 | 50.0% |
[ 34.0% - 34.5% ] 34.38% | 32 | 100.0% |
[ 34.5% - 35.0% ] 34.78% | 23 | 53.3% |
[ 36.5% - 37.0% ] 36.84% | 19 | 80.0% |
[ 41.0% - 41.5% ] 41.40% | 285 | 33.2% |