Costa Rican Female Disability
COMPARE
Costa Rican
Select to Compare
Female Disability
Costa Rican Female Disability
11.7%
DISABILITY | FEMALES
98.1/ 100
METRIC RATING
111th/ 347
METRIC RANK
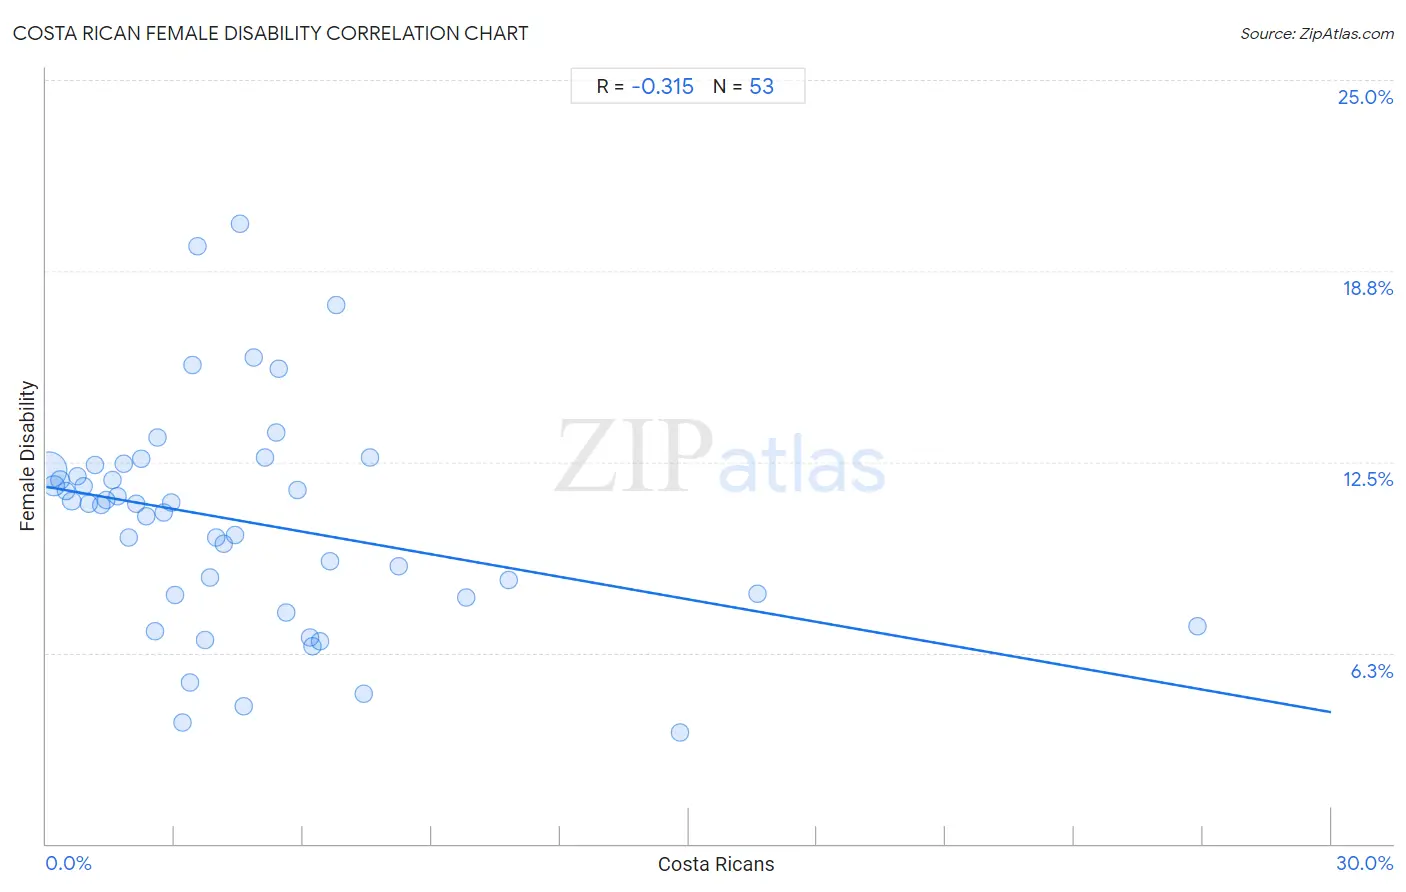
Costa Rican Female Disability Correlation Chart
The statistical analysis conducted on geographies consisting of 253,556,053 people shows a mild negative correlation between the proportion of Costa Ricans and percentage of females with a disability in the United States with a correlation coefficient (R) of -0.315 and weighted average of 11.7%. On average, for every 1% (one percent) increase in Costa Ricans within a typical geography, there is a decrease of 0.25% in percentage of females with a disability.
It is essential to understand that the correlation between the percentage of Costa Ricans and percentage of females with a disability does not imply a direct cause-and-effect relationship. It remains uncertain whether the presence of Costa Ricans influences an upward or downward trend in the level of percentage of females with a disability within an area, or if Costa Ricans simply ended up residing in those areas with higher or lower levels of percentage of females with a disability due to other factors.
Demographics Similar to Costa Ricans by Female Disability
In terms of female disability, the demographic groups most similar to Costa Ricans are Immigrants (11.7%, a difference of 0.020%), Soviet Union (11.7%, a difference of 0.020%), New Zealander (11.7%, a difference of 0.050%), Latvian (11.7%, a difference of 0.070%), and Immigrants from Greece (11.7%, a difference of 0.090%).
| Demographics | Rating | Rank | Female Disability |
| Immigrants from Western Asia | 98.3 /100 | #104 | Exceptional 11.7% |
| Australians | 98.3 /100 | #105 | Exceptional 11.7% |
| Immigrants from Greece | 98.2 /100 | #106 | Exceptional 11.7% |
| Latvians | 98.2 /100 | #107 | Exceptional 11.7% |
| New Zealanders | 98.1 /100 | #108 | Exceptional 11.7% |
| Immigrants | 98.1 /100 | #109 | Exceptional 11.7% |
| Soviet Union | 98.1 /100 | #110 | Exceptional 11.7% |
| Costa Ricans | 98.1 /100 | #111 | Exceptional 11.7% |
| Immigrants from Bangladesh | 97.8 /100 | #112 | Exceptional 11.8% |
| Immigrants from Belarus | 97.8 /100 | #113 | Exceptional 11.8% |
| South Africans | 97.7 /100 | #114 | Exceptional 11.8% |
| Brazilians | 97.7 /100 | #115 | Exceptional 11.8% |
| Immigrants from Morocco | 97.6 /100 | #116 | Exceptional 11.8% |
| Immigrants from Eastern Europe | 97.2 /100 | #117 | Exceptional 11.8% |
| Immigrants from Nigeria | 97.2 /100 | #118 | Exceptional 11.8% |
Costa Rican Female Disability Correlation Summary
| Measurement | Costa Rican Data | Female Disability Data |
| Minimum | 0.054% | 3.6% |
| Maximum | 26.9% | 20.3% |
| Range | 26.8% | 16.7% |
| Mean | 4.6% | 10.6% |
| Median | 3.5% | 11.1% |
| Interquartile 25% (IQ1) | 1.7% | 8.1% |
| Interquartile 75% (IQ3) | 6.0% | 12.3% |
| Interquartile Range (IQR) | 4.3% | 4.2% |
| Standard Deviation (Sample) | 4.6% | 3.6% |
| Standard Deviation (Population) | 4.6% | 3.6% |
Correlation Details
| Costa Rican Percentile | Sample Size | Female Disability |
[ 0.0% - 0.5% ] 0.054% | 193,645,789 | 12.2% |
[ 0.0% - 0.5% ] 0.19% | 35,468,805 | 11.7% |
[ 0.0% - 0.5% ] 0.33% | 11,345,556 | 11.9% |
[ 0.0% - 0.5% ] 0.46% | 4,996,050 | 11.6% |
[ 0.5% - 1.0% ] 0.59% | 2,813,197 | 11.2% |
[ 0.5% - 1.0% ] 0.73% | 1,719,023 | 12.0% |
[ 0.5% - 1.0% ] 0.87% | 890,204 | 11.7% |
[ 1.0% - 1.5% ] 1.00% | 644,350 | 11.1% |
[ 1.0% - 1.5% ] 1.13% | 353,272 | 12.4% |
[ 1.0% - 1.5% ] 1.28% | 323,230 | 11.1% |
[ 1.0% - 1.5% ] 1.41% | 218,565 | 11.2% |
[ 1.5% - 2.0% ] 1.55% | 140,157 | 11.9% |
[ 1.5% - 2.0% ] 1.68% | 147,760 | 11.4% |
[ 1.5% - 2.0% ] 1.81% | 71,675 | 12.4% |
[ 1.5% - 2.0% ] 1.93% | 202,355 | 10.0% |
[ 2.0% - 2.5% ] 2.10% | 90,548 | 11.1% |
[ 2.0% - 2.5% ] 2.22% | 38,329 | 12.6% |
[ 2.0% - 2.5% ] 2.33% | 35,924 | 10.7% |
[ 2.5% - 3.0% ] 2.54% | 7,766 | 7.0% |
[ 2.5% - 3.0% ] 2.60% | 45,531 | 13.3% |
[ 2.5% - 3.0% ] 2.74% | 30,438 | 10.9% |
[ 2.5% - 3.0% ] 2.91% | 70,951 | 11.2% |
[ 3.0% - 3.5% ] 3.01% | 40,321 | 8.1% |
[ 3.0% - 3.5% ] 3.19% | 8,266 | 4.0% |
[ 3.0% - 3.5% ] 3.35% | 24,178 | 5.3% |
[ 3.0% - 3.5% ] 3.42% | 12,649 | 15.7% |
[ 3.5% - 4.0% ] 3.53% | 1,273 | 19.6% |
[ 3.5% - 4.0% ] 3.71% | 2,292 | 6.7% |
[ 3.5% - 4.0% ] 3.83% | 21,507 | 8.7% |
[ 3.5% - 4.0% ] 3.96% | 30,866 | 10.0% |
[ 4.0% - 4.5% ] 4.14% | 8,954 | 9.8% |
[ 4.0% - 4.5% ] 4.41% | 9,781 | 10.1% |
[ 4.5% - 5.0% ] 4.52% | 9,105 | 20.3% |
[ 4.5% - 5.0% ] 4.60% | 587 | 4.5% |
[ 4.5% - 5.0% ] 4.84% | 3,309 | 15.9% |
[ 5.0% - 5.5% ] 5.10% | 16,602 | 12.6% |
[ 5.0% - 5.5% ] 5.36% | 616 | 13.5% |
[ 5.0% - 5.5% ] 5.42% | 277 | 15.5% |
[ 5.5% - 6.0% ] 5.60% | 1,519 | 7.6% |
[ 5.5% - 6.0% ] 5.85% | 8,287 | 11.6% |
[ 6.0% - 6.5% ] 6.15% | 1,594 | 6.8% |
[ 6.0% - 6.5% ] 6.22% | 5,373 | 6.5% |
[ 6.0% - 6.5% ] 6.39% | 5,226 | 6.6% |
[ 6.5% - 7.0% ] 6.61% | 9,676 | 9.2% |
[ 6.5% - 7.0% ] 6.78% | 915 | 17.6% |
[ 7.0% - 7.5% ] 7.41% | 297 | 4.9% |
[ 7.5% - 8.0% ] 7.55% | 159 | 12.6% |
[ 8.0% - 8.5% ] 8.24% | 14,778 | 9.1% |
[ 9.5% - 10.0% ] 9.80% | 11,906 | 8.0% |
[ 10.5% - 11.0% ] 10.81% | 657 | 8.6% |
[ 14.5% - 15.0% ] 14.80% | 4,771 | 3.6% |
[ 16.5% - 17.0% ] 16.60% | 253 | 8.2% |
[ 26.5% - 27.0% ] 26.88% | 584 | 7.1% |