Slavic Female Disability
COMPARE
Slavic
Select to Compare
Female Disability
Slavic Female Disability
12.6%
DISABILITY | FEMALES
3.8/ 100
METRIC RATING
237th/ 347
METRIC RANK
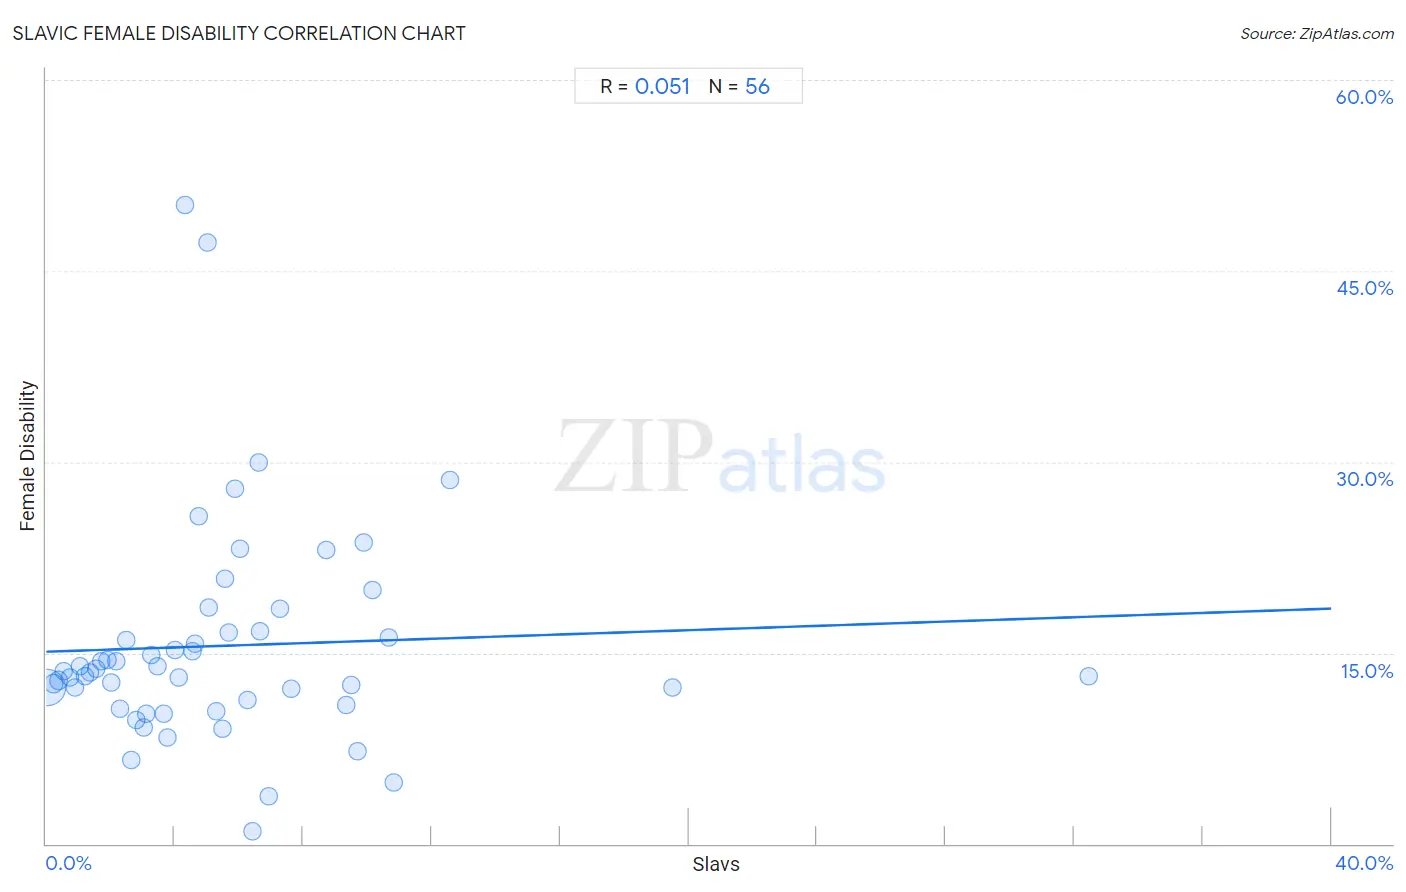
Slavic Female Disability Correlation Chart
The statistical analysis conducted on geographies consisting of 270,849,330 people shows a slight positive correlation between the proportion of Slavs and percentage of females with a disability in the United States with a correlation coefficient (R) of 0.051 and weighted average of 12.6%. On average, for every 1% (one percent) increase in Slavs within a typical geography, there is an increase of 0.085% in percentage of females with a disability.
It is essential to understand that the correlation between the percentage of Slavs and percentage of females with a disability does not imply a direct cause-and-effect relationship. It remains uncertain whether the presence of Slavs influences an upward or downward trend in the level of percentage of females with a disability within an area, or if Slavs simply ended up residing in those areas with higher or lower levels of percentage of females with a disability due to other factors.
Demographics Similar to Slavs by Female Disability
In terms of female disability, the demographic groups most similar to Slavs are Yugoslavian (12.6%, a difference of 0.030%), Barbadian (12.6%, a difference of 0.060%), Immigrants from West Indies (12.6%, a difference of 0.13%), German Russian (12.6%, a difference of 0.15%), and Malaysian (12.5%, a difference of 0.26%).
| Demographics | Rating | Rank | Female Disability |
| Immigrants from Belize | 7.0 /100 | #230 | Tragic 12.5% |
| Belgians | 6.5 /100 | #231 | Tragic 12.5% |
| Immigrants from Somalia | 5.9 /100 | #232 | Tragic 12.5% |
| Immigrants from Iraq | 5.3 /100 | #233 | Tragic 12.5% |
| Scandinavians | 5.3 /100 | #234 | Tragic 12.5% |
| Malaysians | 5.0 /100 | #235 | Tragic 12.5% |
| Immigrants from West Indies | 4.4 /100 | #236 | Tragic 12.6% |
| Slavs | 3.8 /100 | #237 | Tragic 12.6% |
| Yugoslavians | 3.7 /100 | #238 | Tragic 12.6% |
| Barbadians | 3.6 /100 | #239 | Tragic 12.6% |
| German Russians | 3.2 /100 | #240 | Tragic 12.6% |
| Japanese | 2.7 /100 | #241 | Tragic 12.6% |
| Canadians | 2.6 /100 | #242 | Tragic 12.6% |
| Immigrants from Senegal | 2.5 /100 | #243 | Tragic 12.6% |
| Alsatians | 2.5 /100 | #244 | Tragic 12.6% |
Slavic Female Disability Correlation Summary
| Measurement | Slavic Data | Female Disability Data |
| Minimum | 0.050% | 1.0% |
| Maximum | 32.5% | 50.2% |
| Range | 32.4% | 49.2% |
| Mean | 5.5% | 15.5% |
| Median | 4.6% | 13.5% |
| Interquartile 25% (IQ1) | 2.2% | 11.1% |
| Interquartile 75% (IQ3) | 6.8% | 16.6% |
| Interquartile Range (IQR) | 4.6% | 5.6% |
| Standard Deviation (Sample) | 5.2% | 8.7% |
| Standard Deviation (Population) | 5.1% | 8.6% |
Correlation Details
| Slavic Percentile | Sample Size | Female Disability |
[ 0.0% - 0.5% ] 0.050% | 241,113,022 | 12.3% |
[ 0.0% - 0.5% ] 0.22% | 19,816,464 | 12.6% |
[ 0.0% - 0.5% ] 0.39% | 5,286,141 | 12.8% |
[ 0.5% - 1.0% ] 0.56% | 1,947,174 | 13.6% |
[ 0.5% - 1.0% ] 0.73% | 1,067,556 | 13.1% |
[ 0.5% - 1.0% ] 0.89% | 521,179 | 12.3% |
[ 1.0% - 1.5% ] 1.04% | 281,520 | 13.9% |
[ 1.0% - 1.5% ] 1.22% | 264,815 | 13.1% |
[ 1.0% - 1.5% ] 1.36% | 146,723 | 13.5% |
[ 1.5% - 2.0% ] 1.54% | 135,418 | 13.7% |
[ 1.5% - 2.0% ] 1.71% | 42,737 | 14.3% |
[ 1.5% - 2.0% ] 1.89% | 45,605 | 14.4% |
[ 2.0% - 2.5% ] 2.04% | 36,191 | 12.6% |
[ 2.0% - 2.5% ] 2.17% | 19,598 | 14.3% |
[ 2.0% - 2.5% ] 2.31% | 36,891 | 10.6% |
[ 2.0% - 2.5% ] 2.50% | 5,525 | 16.0% |
[ 2.5% - 3.0% ] 2.65% | 5,818 | 6.6% |
[ 2.5% - 3.0% ] 2.82% | 23,398 | 9.8% |
[ 3.0% - 3.5% ] 3.05% | 3,539 | 9.1% |
[ 3.0% - 3.5% ] 3.12% | 12,305 | 10.2% |
[ 3.0% - 3.5% ] 3.28% | 2,807 | 14.8% |
[ 3.0% - 3.5% ] 3.47% | 3,571 | 13.9% |
[ 3.5% - 4.0% ] 3.67% | 3,184 | 10.2% |
[ 3.5% - 4.0% ] 3.78% | 2,834 | 8.3% |
[ 4.0% - 4.5% ] 4.02% | 921 | 15.2% |
[ 4.0% - 4.5% ] 4.14% | 290 | 13.0% |
[ 4.0% - 4.5% ] 4.32% | 672 | 50.2% |
[ 4.5% - 5.0% ] 4.54% | 2,910 | 15.1% |
[ 4.5% - 5.0% ] 4.63% | 691 | 15.7% |
[ 4.5% - 5.0% ] 4.74% | 2,804 | 25.7% |
[ 5.0% - 5.5% ] 5.00% | 200 | 47.2% |
[ 5.0% - 5.5% ] 5.05% | 970 | 18.6% |
[ 5.0% - 5.5% ] 5.28% | 2,536 | 10.4% |
[ 5.0% - 5.5% ] 5.48% | 420 | 9.0% |
[ 5.5% - 6.0% ] 5.55% | 595 | 20.8% |
[ 5.5% - 6.0% ] 5.69% | 686 | 16.6% |
[ 5.5% - 6.0% ] 5.89% | 526 | 27.9% |
[ 6.0% - 6.5% ] 6.02% | 498 | 23.2% |
[ 6.0% - 6.5% ] 6.25% | 304 | 11.3% |
[ 6.0% - 6.5% ] 6.41% | 702 | 1.0% |
[ 6.5% - 7.0% ] 6.62% | 665 | 30.0% |
[ 6.5% - 7.0% ] 6.67% | 150 | 16.7% |
[ 6.5% - 7.0% ] 6.94% | 2,493 | 3.8% |
[ 7.0% - 7.5% ] 7.29% | 768 | 18.5% |
[ 7.5% - 8.0% ] 7.61% | 197 | 12.2% |
[ 8.5% - 9.0% ] 8.72% | 149 | 23.1% |
[ 9.0% - 9.5% ] 9.35% | 1,251 | 10.9% |
[ 9.0% - 9.5% ] 9.48% | 306 | 12.5% |
[ 9.5% - 10.0% ] 9.69% | 949 | 7.3% |
[ 9.5% - 10.0% ] 9.87% | 223 | 23.7% |
[ 10.0% - 10.5% ] 10.14% | 365 | 19.9% |
[ 10.5% - 11.0% ] 10.67% | 75 | 16.2% |
[ 10.5% - 11.0% ] 10.83% | 120 | 4.9% |
[ 12.5% - 13.0% ] 12.55% | 462 | 28.6% |
[ 19.0% - 19.5% ] 19.50% | 995 | 12.3% |
[ 32.0% - 32.5% ] 32.46% | 422 | 13.1% |