Slovak Female Disability
COMPARE
Slovak
Select to Compare
Female Disability
Slovak Female Disability
13.3%
DISABILITY | FEMALES
0.0/ 100
METRIC RATING
297th/ 347
METRIC RANK
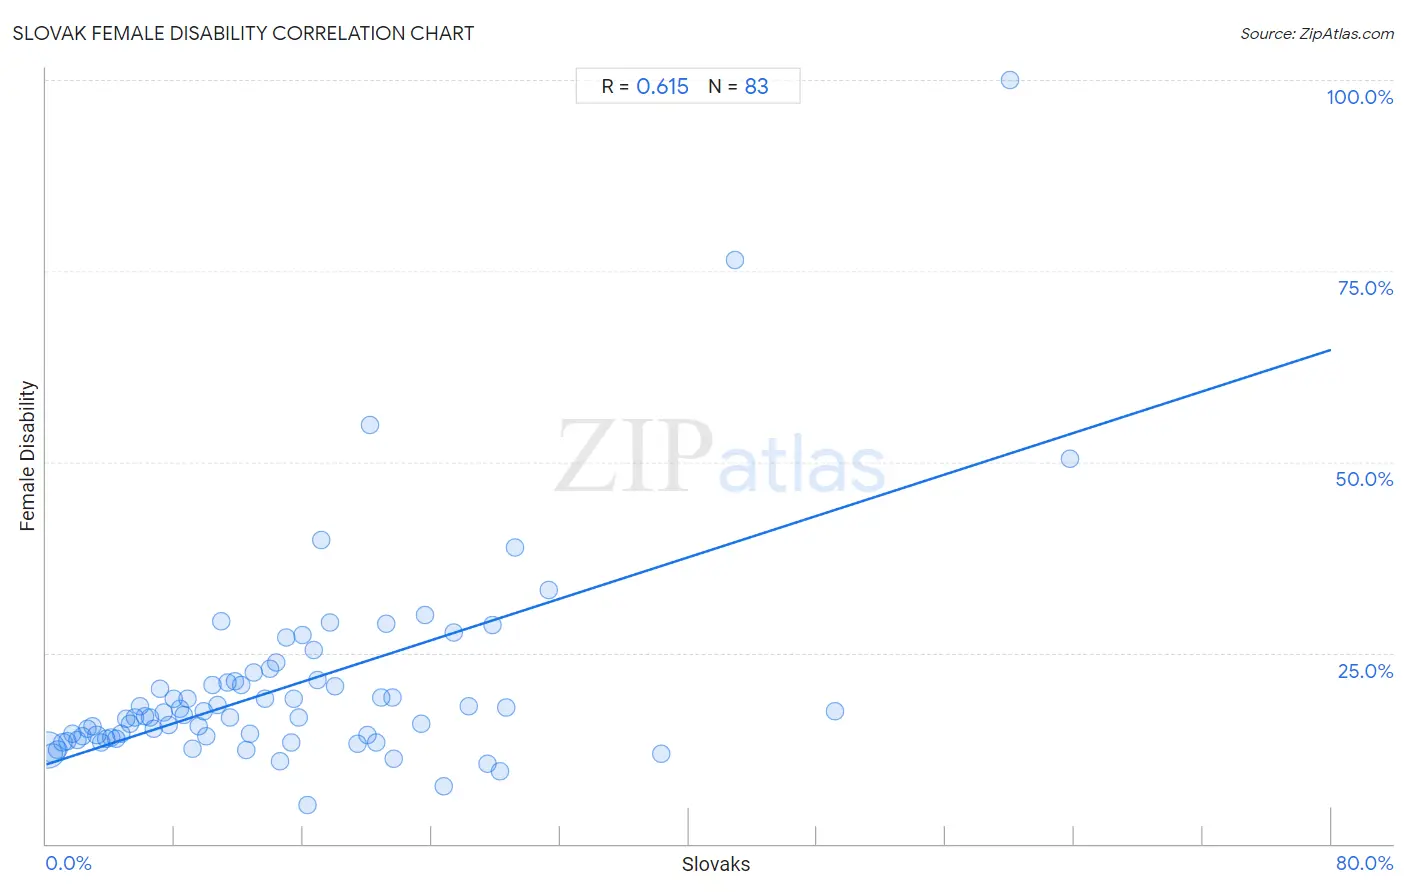
Slovak Female Disability Correlation Chart
The statistical analysis conducted on geographies consisting of 397,843,321 people shows a significant positive correlation between the proportion of Slovaks and percentage of females with a disability in the United States with a correlation coefficient (R) of 0.615 and weighted average of 13.3%. On average, for every 1% (one percent) increase in Slovaks within a typical geography, there is an increase of 0.68% in percentage of females with a disability.
It is essential to understand that the correlation between the percentage of Slovaks and percentage of females with a disability does not imply a direct cause-and-effect relationship. It remains uncertain whether the presence of Slovaks influences an upward or downward trend in the level of percentage of females with a disability within an area, or if Slovaks simply ended up residing in those areas with higher or lower levels of percentage of females with a disability due to other factors.
Demographics Similar to Slovaks by Female Disability
In terms of female disability, the demographic groups most similar to Slovaks are Nepalese (13.3%, a difference of 0.030%), French (13.3%, a difference of 0.17%), Nonimmigrants (13.4%, a difference of 0.30%), Celtic (13.3%, a difference of 0.38%), and Marshallese (13.3%, a difference of 0.42%).
| Demographics | Rating | Rank | Female Disability |
| Immigrants from Yemen | 0.0 /100 | #290 | Tragic 13.2% |
| Shoshone | 0.0 /100 | #291 | Tragic 13.2% |
| Yakama | 0.0 /100 | #292 | Tragic 13.2% |
| Marshallese | 0.0 /100 | #293 | Tragic 13.3% |
| Celtics | 0.0 /100 | #294 | Tragic 13.3% |
| French | 0.0 /100 | #295 | Tragic 13.3% |
| Nepalese | 0.0 /100 | #296 | Tragic 13.3% |
| Slovaks | 0.0 /100 | #297 | Tragic 13.3% |
| Nonimmigrants | 0.0 /100 | #298 | Tragic 13.4% |
| Immigrants from Dominican Republic | 0.0 /100 | #299 | Tragic 13.4% |
| Pennsylvania Germans | 0.0 /100 | #300 | Tragic 13.4% |
| Africans | 0.0 /100 | #301 | Tragic 13.4% |
| Scotch-Irish | 0.0 /100 | #302 | Tragic 13.4% |
| Immigrants from Portugal | 0.0 /100 | #303 | Tragic 13.5% |
| Immigrants from Micronesia | 0.0 /100 | #304 | Tragic 13.5% |
Slovak Female Disability Correlation Summary
| Measurement | Slovak Data | Female Disability Data |
| Minimum | 0.10% | 5.0% |
| Maximum | 63.7% | 100.0% |
| Range | 63.6% | 95.0% |
| Mean | 15.0% | 20.5% |
| Median | 12.4% | 16.6% |
| Interquartile 25% (IQ1) | 6.1% | 13.8% |
| Interquartile 75% (IQ3) | 20.6% | 21.3% |
| Interquartile Range (IQR) | 14.4% | 7.5% |
| Standard Deviation (Sample) | 12.4% | 13.7% |
| Standard Deviation (Population) | 12.3% | 13.6% |
Correlation Details
| Slovak Percentile | Sample Size | Female Disability |
[ 0.0% - 0.5% ] 0.10% | 322,414,708 | 12.3% |
[ 0.0% - 0.5% ] 0.41% | 42,198,456 | 11.9% |
[ 0.5% - 1.0% ] 0.72% | 12,595,212 | 12.3% |
[ 1.0% - 1.5% ] 1.04% | 5,578,069 | 13.3% |
[ 1.0% - 1.5% ] 1.34% | 3,174,549 | 13.5% |
[ 1.5% - 2.0% ] 1.66% | 2,410,533 | 14.4% |
[ 1.5% - 2.0% ] 1.94% | 1,550,673 | 13.5% |
[ 2.0% - 2.5% ] 2.27% | 1,590,556 | 14.1% |
[ 2.5% - 3.0% ] 2.54% | 859,579 | 15.1% |
[ 2.5% - 3.0% ] 2.85% | 902,733 | 15.3% |
[ 3.0% - 3.5% ] 3.15% | 679,896 | 14.3% |
[ 3.0% - 3.5% ] 3.43% | 712,206 | 13.3% |
[ 3.5% - 4.0% ] 3.74% | 478,607 | 13.8% |
[ 4.0% - 4.5% ] 4.06% | 462,311 | 13.9% |
[ 4.0% - 4.5% ] 4.34% | 328,997 | 13.8% |
[ 4.5% - 5.0% ] 4.66% | 213,906 | 14.3% |
[ 4.5% - 5.0% ] 4.96% | 258,589 | 16.3% |
[ 5.0% - 5.5% ] 5.20% | 201,779 | 15.8% |
[ 5.5% - 6.0% ] 5.55% | 103,537 | 16.5% |
[ 5.5% - 6.0% ] 5.87% | 209,660 | 18.0% |
[ 6.0% - 6.5% ] 6.14% | 122,690 | 16.6% |
[ 6.0% - 6.5% ] 6.48% | 101,816 | 16.5% |
[ 6.5% - 7.0% ] 6.71% | 170,643 | 15.0% |
[ 7.0% - 7.5% ] 7.08% | 34,960 | 20.3% |
[ 7.0% - 7.5% ] 7.33% | 41,181 | 17.1% |
[ 7.5% - 8.0% ] 7.65% | 80,328 | 15.5% |
[ 7.5% - 8.0% ] 7.91% | 33,000 | 19.0% |
[ 8.0% - 8.5% ] 8.29% | 66,963 | 17.7% |
[ 8.5% - 9.0% ] 8.54% | 51,836 | 16.8% |
[ 8.5% - 9.0% ] 8.81% | 27,516 | 19.0% |
[ 9.0% - 9.5% ] 9.13% | 17,284 | 12.5% |
[ 9.0% - 9.5% ] 9.47% | 9,473 | 15.5% |
[ 9.5% - 10.0% ] 9.77% | 42,065 | 17.4% |
[ 9.5% - 10.0% ] 9.94% | 2,595 | 14.2% |
[ 10.0% - 10.5% ] 10.38% | 3,286 | 20.7% |
[ 10.5% - 11.0% ] 10.62% | 16,369 | 18.1% |
[ 10.5% - 11.0% ] 10.88% | 3,586 | 29.1% |
[ 11.0% - 11.5% ] 11.28% | 1,241 | 21.2% |
[ 11.0% - 11.5% ] 11.46% | 39,331 | 16.5% |
[ 11.5% - 12.0% ] 11.79% | 1,595 | 21.3% |
[ 12.0% - 12.5% ] 12.16% | 2,640 | 20.8% |
[ 12.0% - 12.5% ] 12.42% | 1,208 | 12.3% |
[ 12.5% - 13.0% ] 12.66% | 5,465 | 14.4% |
[ 12.5% - 13.0% ] 12.96% | 7,124 | 22.5% |
[ 13.5% - 14.0% ] 13.64% | 3,843 | 19.1% |
[ 13.5% - 14.0% ] 13.92% | 2,162 | 22.9% |
[ 14.0% - 14.5% ] 14.29% | 336 | 23.7% |
[ 14.5% - 15.0% ] 14.58% | 1,715 | 10.8% |
[ 14.5% - 15.0% ] 14.94% | 3,306 | 27.0% |
[ 15.0% - 15.5% ] 15.25% | 885 | 13.3% |
[ 15.0% - 15.5% ] 15.41% | 2,259 | 19.1% |
[ 15.5% - 16.0% ] 15.73% | 1,233 | 16.5% |
[ 15.5% - 16.0% ] 15.96% | 639 | 27.4% |
[ 16.0% - 16.5% ] 16.29% | 528 | 5.0% |
[ 16.5% - 17.0% ] 16.64% | 2,151 | 25.4% |
[ 16.5% - 17.0% ] 16.92% | 3,699 | 21.4% |
[ 17.0% - 17.5% ] 17.16% | 204 | 39.8% |
[ 17.5% - 18.0% ] 17.65% | 119 | 29.0% |
[ 17.5% - 18.0% ] 17.99% | 378 | 20.6% |
[ 19.0% - 19.5% ] 19.40% | 1,139 | 13.0% |
[ 20.0% - 20.5% ] 20.00% | 70 | 14.3% |
[ 20.0% - 20.5% ] 20.17% | 476 | 54.9% |
[ 20.5% - 21.0% ] 20.58% | 690 | 13.3% |
[ 20.5% - 21.0% ] 20.83% | 336 | 19.1% |
[ 21.0% - 21.5% ] 21.19% | 840 | 28.8% |
[ 21.5% - 22.0% ] 21.58% | 505 | 19.1% |
[ 21.5% - 22.0% ] 21.62% | 851 | 11.2% |
[ 23.0% - 23.5% ] 23.35% | 1,730 | 15.6% |
[ 23.5% - 24.0% ] 23.60% | 161 | 30.0% |
[ 24.5% - 25.0% ] 24.71% | 348 | 7.6% |
[ 25.0% - 25.5% ] 25.37% | 339 | 27.7% |
[ 26.0% - 26.5% ] 26.32% | 1,345 | 18.0% |
[ 27.0% - 27.5% ] 27.50% | 240 | 10.5% |
[ 27.5% - 28.0% ] 27.78% | 18 | 28.6% |
[ 28.0% - 28.5% ] 28.26% | 138 | 9.6% |
[ 28.5% - 29.0% ] 28.67% | 150 | 17.9% |
[ 29.0% - 29.5% ] 29.18% | 281 | 38.7% |
[ 31.0% - 31.5% ] 31.27% | 291 | 33.2% |
[ 38.0% - 38.5% ] 38.26% | 677 | 11.9% |
[ 42.5% - 43.0% ] 42.86% | 189 | 76.4% |
[ 49.0% - 49.5% ] 49.11% | 112 | 17.4% |
[ 60.0% - 60.5% ] 60.00% | 5 | 100.0% |
[ 63.5% - 64.0% ] 63.74% | 182 | 50.3% |