Scottish Female Disability
COMPARE
Scottish
Select to Compare
Female Disability
Scottish Female Disability
13.0%
DISABILITY | FEMALES
0.1/ 100
METRIC RATING
278th/ 347
METRIC RANK
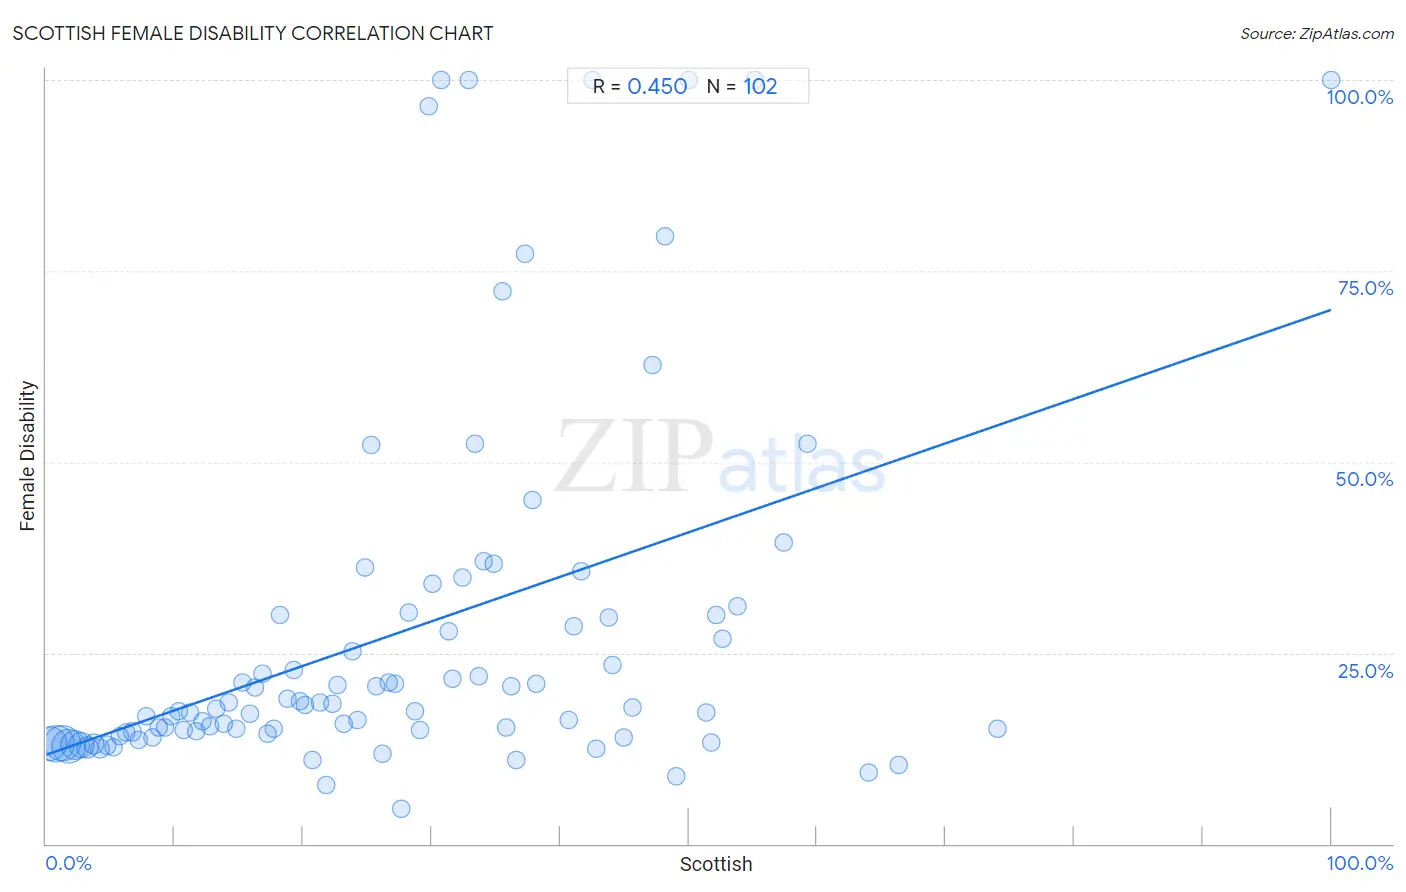
Scottish Female Disability Correlation Chart
The statistical analysis conducted on geographies consisting of 566,851,987 people shows a moderate positive correlation between the proportion of Scottish and percentage of females with a disability in the United States with a correlation coefficient (R) of 0.450 and weighted average of 13.0%. On average, for every 1% (one percent) increase in Scottish within a typical geography, there is an increase of 0.58% in percentage of females with a disability.
It is essential to understand that the correlation between the percentage of Scottish and percentage of females with a disability does not imply a direct cause-and-effect relationship. It remains uncertain whether the presence of Scottish influences an upward or downward trend in the level of percentage of females with a disability within an area, or if Scottish simply ended up residing in those areas with higher or lower levels of percentage of females with a disability due to other factors.
Demographics Similar to Scottish by Female Disability
In terms of female disability, the demographic groups most similar to Scottish are Spanish (13.0%, a difference of 0.080%), Arapaho (13.0%, a difference of 0.24%), Immigrants from Dominica (13.0%, a difference of 0.28%), Irish (13.1%, a difference of 0.33%), and Cheyenne (13.0%, a difference of 0.34%).
| Demographics | Rating | Rank | Female Disability |
| Dutch | 0.2 /100 | #271 | Tragic 12.9% |
| Germans | 0.1 /100 | #272 | Tragic 12.9% |
| Sioux | 0.1 /100 | #273 | Tragic 12.9% |
| Portuguese | 0.1 /100 | #274 | Tragic 13.0% |
| Cheyenne | 0.1 /100 | #275 | Tragic 13.0% |
| Immigrants from Dominica | 0.1 /100 | #276 | Tragic 13.0% |
| Spanish | 0.1 /100 | #277 | Tragic 13.0% |
| Scottish | 0.1 /100 | #278 | Tragic 13.0% |
| Arapaho | 0.1 /100 | #279 | Tragic 13.0% |
| Irish | 0.1 /100 | #280 | Tragic 13.1% |
| U.S. Virgin Islanders | 0.1 /100 | #281 | Tragic 13.1% |
| Welsh | 0.0 /100 | #282 | Tragic 13.1% |
| English | 0.0 /100 | #283 | Tragic 13.1% |
| Hmong | 0.0 /100 | #284 | Tragic 13.1% |
| Bangladeshis | 0.0 /100 | #285 | Tragic 13.1% |
Scottish Female Disability Correlation Summary
| Measurement | Scottish Data | Female Disability Data |
| Minimum | 0.27% | 4.6% |
| Maximum | 100.0% | 100.0% |
| Range | 99.7% | 95.4% |
| Mean | 27.5% | 27.6% |
| Median | 25.5% | 17.8% |
| Interquartile 25% (IQ1) | 12.7% | 14.4% |
| Interquartile 75% (IQ3) | 38.1% | 30.0% |
| Interquartile Range (IQR) | 25.4% | 15.6% |
| Standard Deviation (Sample) | 18.5% | 24.0% |
| Standard Deviation (Population) | 18.5% | 23.9% |
Correlation Details
| Scottish Percentile | Sample Size | Female Disability |
[ 0.0% - 0.5% ] 0.27% | 95,006,486 | 13.0% |
[ 0.5% - 1.0% ] 0.76% | 108,277,738 | 13.0% |
[ 1.0% - 1.5% ] 1.26% | 108,159,637 | 13.2% |
[ 1.5% - 2.0% ] 1.73% | 94,492,888 | 12.8% |
[ 2.0% - 2.5% ] 2.23% | 64,738,095 | 12.9% |
[ 2.5% - 3.0% ] 2.74% | 41,667,140 | 12.9% |
[ 3.0% - 3.5% ] 3.23% | 22,101,370 | 12.6% |
[ 3.5% - 4.0% ] 3.72% | 12,952,737 | 13.1% |
[ 4.0% - 4.5% ] 4.21% | 7,751,324 | 12.5% |
[ 4.5% - 5.0% ] 4.72% | 4,085,257 | 12.8% |
[ 5.0% - 5.5% ] 5.22% | 2,495,090 | 12.7% |
[ 5.5% - 6.0% ] 5.71% | 1,512,369 | 14.0% |
[ 6.0% - 6.5% ] 6.22% | 873,023 | 14.5% |
[ 6.5% - 7.0% ] 6.72% | 629,036 | 14.7% |
[ 7.0% - 7.5% ] 7.23% | 466,988 | 13.6% |
[ 7.5% - 8.0% ] 7.74% | 291,986 | 16.6% |
[ 8.0% - 8.5% ] 8.23% | 341,232 | 14.0% |
[ 8.5% - 9.0% ] 8.78% | 181,095 | 15.2% |
[ 9.0% - 9.5% ] 9.22% | 137,619 | 15.2% |
[ 9.5% - 10.0% ] 9.73% | 103,629 | 16.8% |
[ 10.0% - 10.5% ] 10.26% | 76,241 | 17.3% |
[ 10.5% - 11.0% ] 10.73% | 93,180 | 14.9% |
[ 11.0% - 11.5% ] 11.21% | 66,897 | 17.1% |
[ 11.5% - 12.0% ] 11.70% | 41,779 | 14.7% |
[ 12.0% - 12.5% ] 12.20% | 47,755 | 16.1% |
[ 12.5% - 13.0% ] 12.71% | 41,866 | 15.4% |
[ 13.0% - 13.5% ] 13.22% | 21,753 | 17.7% |
[ 13.5% - 14.0% ] 13.80% | 19,729 | 15.7% |
[ 14.0% - 14.5% ] 14.23% | 19,378 | 18.5% |
[ 14.5% - 15.0% ] 14.81% | 28,749 | 15.1% |
[ 15.0% - 15.5% ] 15.26% | 10,852 | 21.1% |
[ 15.5% - 16.0% ] 15.82% | 16,932 | 17.0% |
[ 16.0% - 16.5% ] 16.22% | 4,599 | 20.4% |
[ 16.5% - 17.0% ] 16.80% | 4,674 | 22.2% |
[ 17.0% - 17.5% ] 17.23% | 4,992 | 14.4% |
[ 17.5% - 18.0% ] 17.69% | 11,426 | 15.1% |
[ 18.0% - 18.5% ] 18.21% | 7,292 | 30.0% |
[ 18.5% - 19.0% ] 18.74% | 8,250 | 19.0% |
[ 19.0% - 19.5% ] 19.27% | 3,970 | 22.8% |
[ 19.5% - 20.0% ] 19.75% | 8,966 | 18.6% |
[ 20.0% - 20.5% ] 20.17% | 2,786 | 18.2% |
[ 20.5% - 21.0% ] 20.73% | 6,343 | 10.9% |
[ 21.0% - 21.5% ] 21.32% | 1,393 | 18.5% |
[ 21.5% - 22.0% ] 21.82% | 4,491 | 7.7% |
[ 22.0% - 22.5% ] 22.23% | 940 | 18.3% |
[ 22.5% - 23.0% ] 22.68% | 2,998 | 20.8% |
[ 23.0% - 23.5% ] 23.19% | 1,216 | 15.7% |
[ 23.5% - 24.0% ] 23.84% | 2,290 | 25.2% |
[ 24.0% - 24.5% ] 24.26% | 305 | 16.1% |
[ 24.5% - 25.0% ] 24.79% | 605 | 36.2% |
[ 25.0% - 25.5% ] 25.30% | 1,727 | 52.2% |
[ 25.5% - 26.0% ] 25.71% | 1,945 | 20.5% |
[ 26.0% - 26.5% ] 26.16% | 669 | 11.8% |
[ 26.5% - 27.0% ] 26.70% | 2,165 | 21.1% |
[ 27.0% - 27.5% ] 27.19% | 526 | 20.9% |
[ 27.5% - 28.0% ] 27.65% | 680 | 4.6% |
[ 28.0% - 28.5% ] 28.22% | 1,049 | 30.3% |
[ 28.5% - 29.0% ] 28.67% | 1,287 | 17.3% |
[ 29.0% - 29.5% ] 29.07% | 853 | 14.8% |
[ 29.5% - 30.0% ] 29.73% | 111 | 96.6% |
[ 30.0% - 30.5% ] 30.08% | 369 | 34.1% |
[ 30.5% - 31.0% ] 30.77% | 13 | 100.0% |
[ 31.0% - 31.5% ] 31.30% | 1,987 | 27.8% |
[ 31.5% - 32.0% ] 31.63% | 1,562 | 21.6% |
[ 32.0% - 32.5% ] 32.42% | 219 | 34.8% |
[ 32.5% - 33.0% ] 32.85% | 137 | 100.0% |
[ 33.0% - 33.5% ] 33.33% | 30 | 52.4% |
[ 33.5% - 34.0% ] 33.64% | 217 | 21.9% |
[ 34.0% - 34.5% ] 34.06% | 323 | 37.0% |
[ 34.5% - 35.0% ] 34.84% | 1,346 | 36.6% |
[ 35.0% - 35.5% ] 35.50% | 231 | 72.3% |
[ 35.5% - 36.0% ] 35.76% | 151 | 15.2% |
[ 36.0% - 36.5% ] 36.18% | 246 | 20.6% |
[ 36.5% - 37.0% ] 36.57% | 216 | 11.0% |
[ 37.0% - 37.5% ] 37.28% | 338 | 77.3% |
[ 37.5% - 38.0% ] 37.86% | 560 | 45.0% |
[ 38.0% - 38.5% ] 38.14% | 388 | 21.0% |
[ 40.5% - 41.0% ] 40.69% | 145 | 16.1% |
[ 41.0% - 41.5% ] 41.06% | 492 | 28.4% |
[ 41.5% - 42.0% ] 41.59% | 226 | 35.7% |
[ 42.0% - 42.5% ] 42.50% | 80 | 100.0% |
[ 42.5% - 43.0% ] 42.77% | 318 | 12.5% |
[ 43.5% - 44.0% ] 43.75% | 64 | 29.7% |
[ 44.0% - 44.5% ] 44.07% | 59 | 23.3% |
[ 44.5% - 45.0% ] 44.92% | 492 | 14.0% |
[ 45.5% - 46.0% ] 45.59% | 465 | 17.9% |
[ 47.0% - 47.5% ] 47.17% | 106 | 62.7% |
[ 48.0% - 48.5% ] 48.15% | 54 | 79.5% |
[ 49.0% - 49.5% ] 49.00% | 451 | 8.9% |
[ 50.0% - 50.5% ] 50.00% | 22 | 100.0% |
[ 51.0% - 51.5% ] 51.38% | 654 | 17.1% |
[ 51.5% - 52.0% ] 51.79% | 112 | 13.2% |
[ 52.0% - 52.5% ] 52.17% | 69 | 30.0% |
[ 52.5% - 53.0% ] 52.66% | 188 | 26.9% |
[ 53.5% - 54.0% ] 53.75% | 80 | 31.1% |
[ 55.0% - 55.5% ] 55.15% | 136 | 100.0% |
[ 57.0% - 57.5% ] 57.42% | 472 | 39.5% |
[ 59.0% - 59.5% ] 59.26% | 54 | 52.4% |
[ 64.0% - 64.5% ] 64.00% | 75 | 9.3% |
[ 66.0% - 66.5% ] 66.33% | 196 | 10.4% |
[ 74.0% - 74.5% ] 74.02% | 204 | 15.0% |
[ 99.5% - 100.0% ] 100.00% | 42 | 100.0% |