Russian Female Disability
COMPARE
Russian
Select to Compare
Female Disability
Russian Female Disability
11.8%
DISABILITY | FEMALES
96.5/ 100
METRIC RATING
124th/ 347
METRIC RANK
Russian Female Disability Correlation Chart
The statistical analysis conducted on geographies consisting of 512,105,615 people shows a moderate positive correlation between the proportion of Russians and percentage of females with a disability in the United States with a correlation coefficient (R) of 0.446 and weighted average of 11.8%. On average, for every 1% (one percent) increase in Russians within a typical geography, there is an increase of 0.44% in percentage of females with a disability.
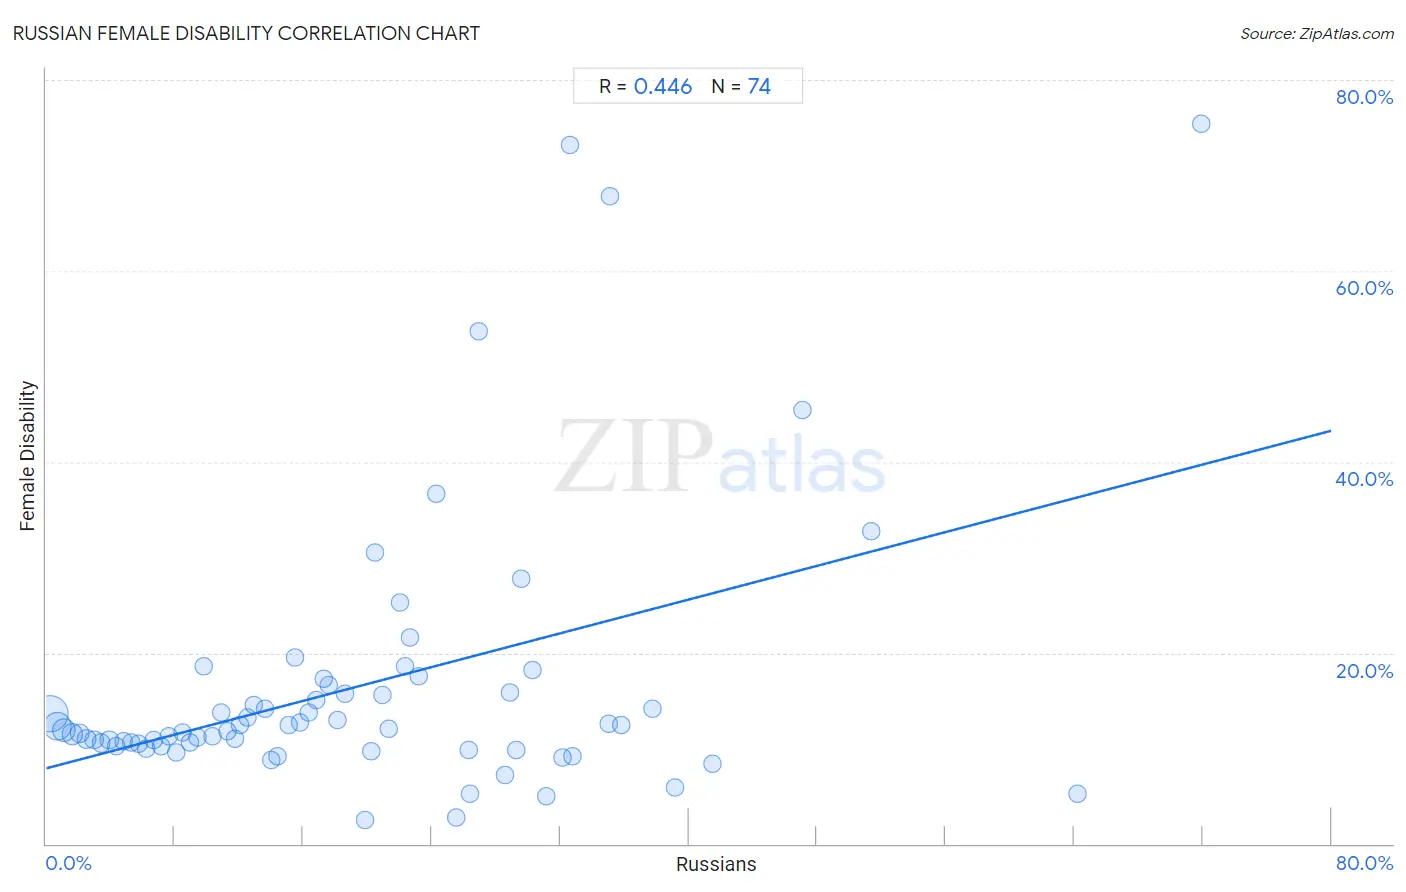
It is essential to understand that the correlation between the percentage of Russians and percentage of females with a disability does not imply a direct cause-and-effect relationship. It remains uncertain whether the presence of Russians influences an upward or downward trend in the level of percentage of females with a disability within an area, or if Russians simply ended up residing in those areas with higher or lower levels of percentage of females with a disability due to other factors.
Demographics Similar to Russians by Female Disability
In terms of female disability, the demographic groups most similar to Russians are Immigrants from Italy (11.8%, a difference of 0.030%), Immigrants from Croatia (11.8%, a difference of 0.050%), Immigrants from Europe (11.8%, a difference of 0.090%), Immigrants from North Macedonia (11.8%, a difference of 0.10%), and Immigrants from Netherlands (11.8%, a difference of 0.11%).
| Demographics | Rating | Rank | Female Disability |
| Immigrants from Eastern Europe | 97.2 /100 | #117 | Exceptional 11.8% |
| Immigrants from Nigeria | 97.2 /100 | #118 | Exceptional 11.8% |
| Immigrants from Uganda | 97.2 /100 | #119 | Exceptional 11.8% |
| Immigrants from Kazakhstan | 97.0 /100 | #120 | Exceptional 11.8% |
| Immigrants from Netherlands | 96.9 /100 | #121 | Exceptional 11.8% |
| Immigrants from North Macedonia | 96.8 /100 | #122 | Exceptional 11.8% |
| Immigrants from Croatia | 96.7 /100 | #123 | Exceptional 11.8% |
| Russians | 96.5 /100 | #124 | Exceptional 11.8% |
| Immigrants from Italy | 96.4 /100 | #125 | Exceptional 11.8% |
| Immigrants from Europe | 96.2 /100 | #126 | Exceptional 11.8% |
| South American Indians | 95.8 /100 | #127 | Exceptional 11.8% |
| Immigrants from Latvia | 95.6 /100 | #128 | Exceptional 11.8% |
| Macedonians | 95.5 /100 | #129 | Exceptional 11.8% |
| Nicaraguans | 95.2 /100 | #130 | Exceptional 11.9% |
| Arabs | 95.1 /100 | #131 | Exceptional 11.9% |
Russian Female Disability Correlation Summary
| Measurement | Russian Data | Female Disability Data |
| Minimum | 0.22% | 2.5% |
| Maximum | 71.9% | 75.4% |
| Range | 71.7% | 73.0% |
| Mean | 19.5% | 16.5% |
| Median | 17.1% | 12.0% |
| Interquartile 25% (IQ1) | 8.5% | 10.3% |
| Interquartile 75% (IQ3) | 28.6% | 15.8% |
| Interquartile Range (IQR) | 20.1% | 5.5% |
| Standard Deviation (Sample) | 14.4% | 14.3% |
| Standard Deviation (Population) | 14.3% | 14.2% |
Correlation Details
| Russian Percentile | Sample Size | Female Disability |
[ 0.0% - 0.5% ] 0.22% | 235,418,314 | 13.6% |
[ 0.5% - 1.0% ] 0.67% | 127,151,106 | 12.3% |
[ 1.0% - 1.5% ] 1.12% | 59,150,508 | 11.9% |
[ 1.5% - 2.0% ] 1.60% | 36,197,675 | 11.5% |
[ 2.0% - 2.5% ] 2.07% | 25,043,580 | 11.6% |
[ 2.5% - 3.0% ] 2.51% | 8,430,841 | 10.9% |
[ 2.5% - 3.0% ] 2.98% | 5,719,906 | 10.9% |
[ 3.0% - 3.5% ] 3.44% | 3,359,460 | 10.6% |
[ 3.5% - 4.0% ] 3.92% | 2,493,394 | 10.9% |
[ 4.0% - 4.5% ] 4.34% | 2,290,707 | 10.3% |
[ 4.5% - 5.0% ] 4.82% | 1,274,961 | 10.8% |
[ 5.0% - 5.5% ] 5.30% | 1,321,315 | 10.6% |
[ 5.5% - 6.0% ] 5.73% | 751,162 | 10.5% |
[ 6.0% - 6.5% ] 6.23% | 784,532 | 10.0% |
[ 6.5% - 7.0% ] 6.71% | 629,631 | 10.9% |
[ 7.0% - 7.5% ] 7.18% | 391,917 | 10.2% |
[ 7.5% - 8.0% ] 7.63% | 465,138 | 11.2% |
[ 8.0% - 8.5% ] 8.08% | 296,810 | 9.6% |
[ 8.0% - 8.5% ] 8.49% | 120,073 | 11.6% |
[ 8.5% - 9.0% ] 8.91% | 226,336 | 10.6% |
[ 9.0% - 9.5% ] 9.39% | 151,387 | 11.2% |
[ 9.5% - 10.0% ] 9.80% | 88,709 | 18.6% |
[ 10.0% - 10.5% ] 10.39% | 62,332 | 11.2% |
[ 10.5% - 11.0% ] 10.87% | 27,899 | 13.7% |
[ 11.0% - 11.5% ] 11.29% | 28,640 | 11.8% |
[ 11.5% - 12.0% ] 11.76% | 14,718 | 11.0% |
[ 12.0% - 12.5% ] 12.07% | 31,609 | 12.5% |
[ 12.5% - 13.0% ] 12.54% | 4,451 | 13.3% |
[ 12.5% - 13.0% ] 12.93% | 14,112 | 14.5% |
[ 13.5% - 14.0% ] 13.64% | 4,434 | 14.2% |
[ 14.0% - 14.5% ] 14.01% | 17,047 | 8.8% |
[ 14.0% - 14.5% ] 14.42% | 12,833 | 9.2% |
[ 15.0% - 15.5% ] 15.08% | 7,299 | 12.4% |
[ 15.0% - 15.5% ] 15.49% | 1,504 | 19.5% |
[ 15.5% - 16.0% ] 15.82% | 5,555 | 12.8% |
[ 16.0% - 16.5% ] 16.31% | 2,986 | 13.7% |
[ 16.5% - 17.0% ] 16.83% | 4,873 | 15.0% |
[ 17.0% - 17.5% ] 17.31% | 2,606 | 17.3% |
[ 17.5% - 18.0% ] 17.60% | 83,069 | 16.7% |
[ 18.0% - 18.5% ] 18.11% | 370 | 13.0% |
[ 18.5% - 19.0% ] 18.61% | 2,364 | 15.7% |
[ 19.5% - 20.0% ] 19.83% | 237 | 2.5% |
[ 20.0% - 20.5% ] 20.23% | 2,640 | 9.7% |
[ 20.0% - 20.5% ] 20.46% | 3,108 | 30.5% |
[ 20.5% - 21.0% ] 20.92% | 980 | 15.6% |
[ 21.0% - 21.5% ] 21.36% | 618 | 12.1% |
[ 21.5% - 22.0% ] 21.99% | 423 | 25.2% |
[ 22.0% - 22.5% ] 22.33% | 2,580 | 18.5% |
[ 22.5% - 23.0% ] 22.68% | 291 | 21.6% |
[ 23.0% - 23.5% ] 23.19% | 789 | 17.5% |
[ 24.0% - 24.5% ] 24.29% | 140 | 36.7% |
[ 25.5% - 26.0% ] 25.55% | 364 | 2.8% |
[ 26.0% - 26.5% ] 26.28% | 666 | 9.8% |
[ 26.0% - 26.5% ] 26.35% | 353 | 5.2% |
[ 26.5% - 27.0% ] 26.92% | 78 | 53.7% |
[ 28.5% - 29.0% ] 28.57% | 56 | 7.1% |
[ 28.5% - 29.0% ] 28.89% | 90 | 15.8% |
[ 29.0% - 29.5% ] 29.23% | 1,683 | 9.9% |
[ 29.5% - 30.0% ] 29.55% | 44 | 27.8% |
[ 30.0% - 30.5% ] 30.30% | 462 | 18.1% |
[ 31.0% - 31.5% ] 31.13% | 681 | 5.0% |
[ 32.0% - 32.5% ] 32.12% | 137 | 9.1% |
[ 32.5% - 33.0% ] 32.61% | 92 | 73.2% |
[ 32.5% - 33.0% ] 32.79% | 427 | 9.2% |
[ 34.5% - 35.0% ] 35.00% | 640 | 12.6% |
[ 35.0% - 35.5% ] 35.14% | 74 | 67.8% |
[ 35.5% - 36.0% ] 35.79% | 95 | 12.5% |
[ 37.5% - 38.0% ] 37.74% | 106 | 14.1% |
[ 39.0% - 39.5% ] 39.12% | 979 | 5.9% |
[ 41.0% - 41.5% ] 41.49% | 94 | 8.3% |
[ 47.0% - 47.5% ] 47.06% | 51 | 45.5% |
[ 51.0% - 51.5% ] 51.39% | 72 | 32.8% |
[ 64.0% - 64.5% ] 64.23% | 274 | 5.2% |
[ 71.5% - 72.0% ] 71.88% | 128 | 75.4% |