Alaskan Athabascan Female Disability
COMPARE
Alaskan Athabascan
Select to Compare
Female Disability
Alaskan Athabascan Female Disability
13.9%
DISABILITY | FEMALES
0.0/ 100
METRIC RATING
315th/ 347
METRIC RANK
Alaskan Athabascan Female Disability Correlation Chart
The statistical analysis conducted on geographies consisting of 45,817,882 people shows a weak positive correlation between the proportion of Alaskan Athabascans and percentage of females with a disability in the United States with a correlation coefficient (R) of 0.220 and weighted average of 13.9%. On average, for every 1% (one percent) increase in Alaskan Athabascans within a typical geography, there is an increase of 0.050% in percentage of females with a disability.
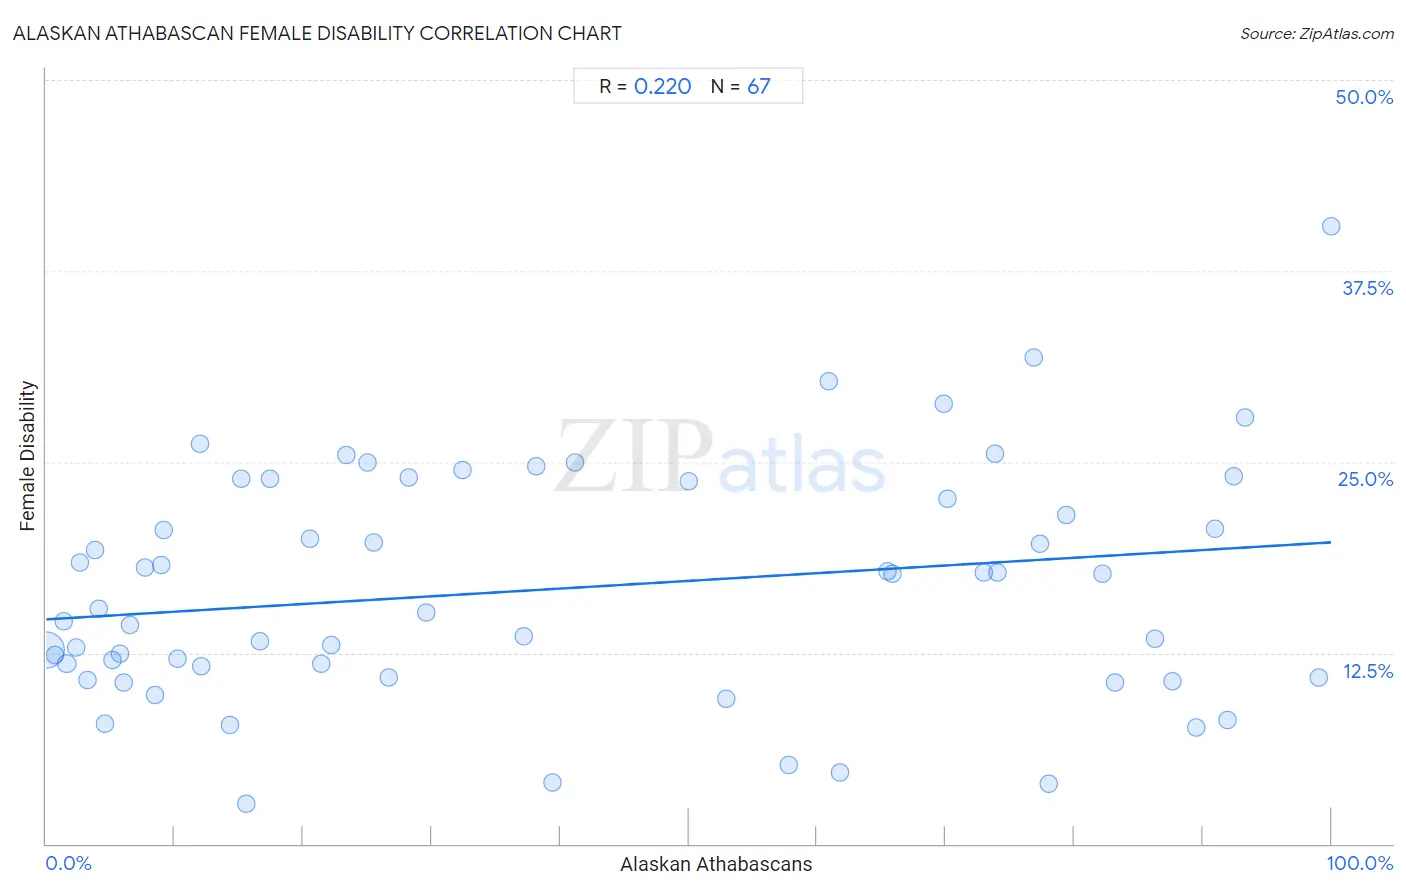
It is essential to understand that the correlation between the percentage of Alaskan Athabascans and percentage of females with a disability does not imply a direct cause-and-effect relationship. It remains uncertain whether the presence of Alaskan Athabascans influences an upward or downward trend in the level of percentage of females with a disability within an area, or if Alaskan Athabascans simply ended up residing in those areas with higher or lower levels of percentage of females with a disability due to other factors.
Demographics Similar to Alaskan Athabascans by Female Disability
In terms of female disability, the demographic groups most similar to Alaskan Athabascans are Spanish American (14.0%, a difference of 0.36%), Chippewa (14.0%, a difference of 0.47%), Paiute (14.0%, a difference of 0.58%), Puget Sound Salish (13.8%, a difference of 0.59%), and Blackfeet (13.8%, a difference of 0.69%).
| Demographics | Rating | Rank | Female Disability |
| Cree | 0.0 /100 | #308 | Tragic 13.7% |
| French American Indians | 0.0 /100 | #309 | Tragic 13.7% |
| Apache | 0.0 /100 | #310 | Tragic 13.7% |
| Hopi | 0.0 /100 | #311 | Tragic 13.7% |
| Delaware | 0.0 /100 | #312 | Tragic 13.8% |
| Blackfeet | 0.0 /100 | #313 | Tragic 13.8% |
| Puget Sound Salish | 0.0 /100 | #314 | Tragic 13.8% |
| Alaskan Athabascans | 0.0 /100 | #315 | Tragic 13.9% |
| Spanish Americans | 0.0 /100 | #316 | Tragic 14.0% |
| Chippewa | 0.0 /100 | #317 | Tragic 14.0% |
| Paiute | 0.0 /100 | #318 | Tragic 14.0% |
| Iroquois | 0.0 /100 | #319 | Tragic 14.0% |
| Americans | 0.0 /100 | #320 | Tragic 14.1% |
| Potawatomi | 0.0 /100 | #321 | Tragic 14.1% |
| Pueblo | 0.0 /100 | #322 | Tragic 14.1% |
Alaskan Athabascan Female Disability Correlation Summary
| Measurement | Alaskan Athabascan Data | Female Disability Data |
| Minimum | 0.025% | 2.6% |
| Maximum | 100.0% | 40.4% |
| Range | 100.0% | 37.8% |
| Mean | 40.1% | 16.7% |
| Median | 28.2% | 15.4% |
| Interquartile 25% (IQ1) | 9.0% | 10.9% |
| Interquartile 75% (IQ3) | 73.8% | 23.7% |
| Interquartile Range (IQR) | 64.9% | 12.8% |
| Standard Deviation (Sample) | 33.2% | 7.6% |
| Standard Deviation (Population) | 32.9% | 7.6% |
Correlation Details
| Alaskan Athabascan Percentile | Sample Size | Female Disability |
[ 0.0% - 0.5% ] 0.025% | 44,547,940 | 12.7% |
[ 0.5% - 1.0% ] 0.67% | 228,235 | 12.3% |
[ 1.0% - 1.5% ] 1.34% | 116,887 | 14.6% |
[ 1.5% - 2.0% ] 1.59% | 514,247 | 11.8% |
[ 2.0% - 2.5% ] 2.29% | 152,758 | 12.8% |
[ 2.5% - 3.0% ] 2.63% | 13,862 | 18.4% |
[ 3.0% - 3.5% ] 3.19% | 79,978 | 10.7% |
[ 3.5% - 4.0% ] 3.81% | 6,568 | 19.2% |
[ 4.0% - 4.5% ] 4.09% | 18,102 | 15.4% |
[ 4.5% - 5.0% ] 4.61% | 2,061 | 7.8% |
[ 5.0% - 5.5% ] 5.20% | 29,293 | 12.0% |
[ 5.5% - 6.0% ] 5.76% | 20,604 | 12.5% |
[ 6.0% - 6.5% ] 6.07% | 1,170 | 10.6% |
[ 6.5% - 7.0% ] 6.56% | 33,211 | 14.3% |
[ 7.5% - 8.0% ] 7.65% | 405 | 18.1% |
[ 8.0% - 8.5% ] 8.49% | 5,499 | 9.7% |
[ 8.5% - 9.0% ] 8.96% | 19,529 | 18.3% |
[ 9.0% - 9.5% ] 9.13% | 964 | 20.5% |
[ 10.0% - 10.5% ] 10.26% | 6,542 | 12.1% |
[ 11.5% - 12.0% ] 11.97% | 234 | 26.2% |
[ 12.0% - 12.5% ] 12.01% | 283 | 11.7% |
[ 14.0% - 14.5% ] 14.29% | 182 | 7.8% |
[ 15.0% - 15.5% ] 15.22% | 92 | 23.9% |
[ 15.5% - 16.0% ] 15.52% | 116 | 2.6% |
[ 16.5% - 17.0% ] 16.60% | 235 | 13.2% |
[ 17.0% - 17.5% ] 17.38% | 1,927 | 23.9% |
[ 20.5% - 21.0% ] 20.57% | 1,167 | 19.9% |
[ 21.0% - 21.5% ] 21.39% | 1,052 | 11.8% |
[ 22.0% - 22.5% ] 22.16% | 388 | 13.0% |
[ 23.0% - 23.5% ] 23.37% | 522 | 25.5% |
[ 25.0% - 25.5% ] 25.00% | 12 | 25.0% |
[ 25.0% - 25.5% ] 25.49% | 761 | 19.7% |
[ 26.5% - 27.0% ] 26.65% | 439 | 10.9% |
[ 28.0% - 28.5% ] 28.21% | 78 | 24.0% |
[ 29.5% - 30.0% ] 29.58% | 71 | 15.2% |
[ 32.0% - 32.5% ] 32.34% | 1,719 | 24.4% |
[ 37.0% - 37.5% ] 37.20% | 508 | 13.6% |
[ 38.0% - 38.5% ] 38.10% | 525 | 24.7% |
[ 39.0% - 39.5% ] 39.44% | 71 | 4.0% |
[ 41.0% - 41.5% ] 41.18% | 68 | 25.0% |
[ 50.0% - 50.5% ] 50.00% | 470 | 23.7% |
[ 52.5% - 53.0% ] 52.89% | 329 | 9.5% |
[ 57.5% - 58.0% ] 57.74% | 1,254 | 5.2% |
[ 60.5% - 61.0% ] 60.87% | 69 | 30.3% |
[ 61.5% - 62.0% ] 61.76% | 68 | 4.7% |
[ 65.0% - 65.5% ] 65.45% | 220 | 17.8% |
[ 65.5% - 66.0% ] 65.85% | 41 | 17.6% |
[ 69.5% - 70.0% ] 69.85% | 272 | 28.8% |
[ 70.0% - 70.5% ] 70.15% | 650 | 22.6% |
[ 72.5% - 73.0% ] 72.99% | 274 | 17.8% |
[ 73.5% - 74.0% ] 73.81% | 252 | 25.5% |
[ 74.0% - 74.5% ] 74.07% | 270 | 17.8% |
[ 76.5% - 77.0% ] 76.80% | 388 | 31.8% |
[ 77.0% - 77.5% ] 77.31% | 952 | 19.6% |
[ 77.5% - 78.0% ] 77.98% | 218 | 3.9% |
[ 79.0% - 79.5% ] 79.37% | 252 | 21.6% |
[ 82.0% - 82.5% ] 82.22% | 45 | 17.6% |
[ 83.0% - 83.5% ] 83.18% | 428 | 10.5% |
[ 86.0% - 86.5% ] 86.26% | 364 | 13.4% |
[ 87.5% - 88.0% ] 87.62% | 420 | 10.6% |
[ 89.5% - 90.0% ] 89.53% | 554 | 7.6% |
[ 90.5% - 91.0% ] 90.95% | 398 | 20.6% |
[ 91.5% - 92.0% ] 91.95% | 174 | 8.1% |
[ 92.0% - 92.5% ] 92.37% | 524 | 24.0% |
[ 93.0% - 93.5% ] 93.28% | 238 | 27.9% |
[ 99.0% - 99.5% ] 99.00% | 201 | 10.9% |
[ 99.5% - 100.0% ] 100.00% | 252 | 40.4% |