Austrian 3 or more Vehicles in Household
COMPARE
Austrian
Select to Compare
3 or more Vehicles in Household
Austrian 3 or more Vehicles in Household
20.9%
3+ VEHICLES AVAILABLE
97.5/ 100
METRIC RATING
105th/ 347
METRIC RANK
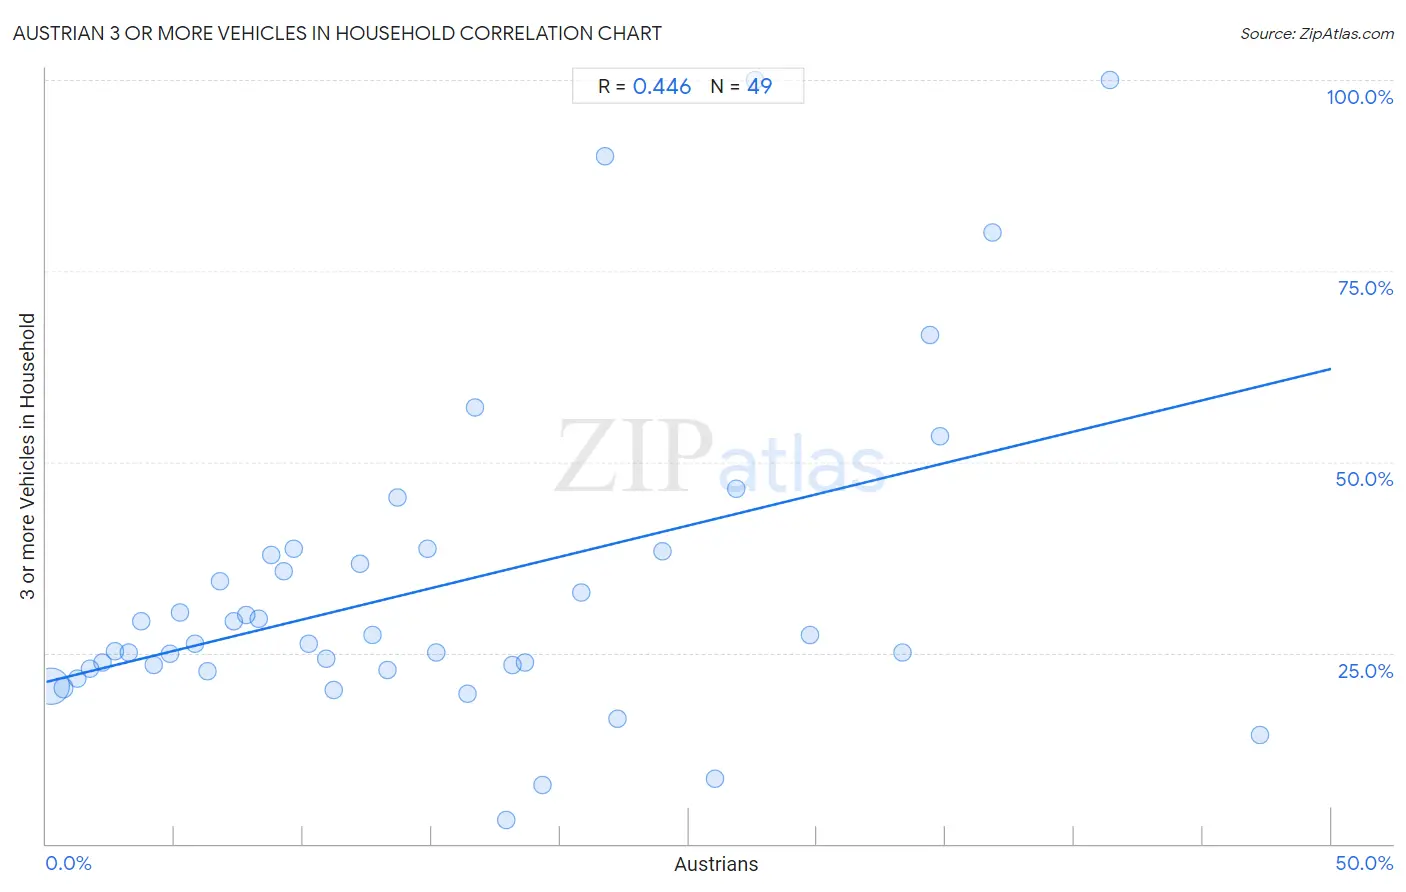
Austrian 3 or more Vehicles in Household Correlation Chart
The statistical analysis conducted on geographies consisting of 451,648,303 people shows a moderate positive correlation between the proportion of Austrians and percentage of households with 3 or more vehicles available in the United States with a correlation coefficient (R) of 0.446 and weighted average of 20.9%. On average, for every 1% (one percent) increase in Austrians within a typical geography, there is an increase of 0.82% in percentage of households with 3 or more vehicles available.
It is essential to understand that the correlation between the percentage of Austrians and percentage of households with 3 or more vehicles available does not imply a direct cause-and-effect relationship. It remains uncertain whether the presence of Austrians influences an upward or downward trend in the level of percentage of households with 3 or more vehicles available within an area, or if Austrians simply ended up residing in those areas with higher or lower levels of percentage of households with 3 or more vehicles available due to other factors.
Demographics Similar to Austrians by 3 or more Vehicles in Household
In terms of 3 or more vehicles in household, the demographic groups most similar to Austrians are Bolivian (20.8%, a difference of 0.090%), Luxembourger (20.9%, a difference of 0.10%), Immigrants from Germany (20.8%, a difference of 0.13%), Dutch West Indian (20.9%, a difference of 0.19%), and Seminole (20.9%, a difference of 0.23%).
| Demographics | Rating | Rank | 3 or more Vehicles in Household |
| Hmong | 98.2 /100 | #98 | Exceptional 21.0% |
| Alaska Natives | 98.2 /100 | #99 | Exceptional 21.0% |
| Comanche | 98.2 /100 | #100 | Exceptional 21.0% |
| Blackfeet | 97.9 /100 | #101 | Exceptional 20.9% |
| Seminole | 97.8 /100 | #102 | Exceptional 20.9% |
| Dutch West Indians | 97.8 /100 | #103 | Exceptional 20.9% |
| Luxembourgers | 97.7 /100 | #104 | Exceptional 20.9% |
| Austrians | 97.5 /100 | #105 | Exceptional 20.9% |
| Bolivians | 97.4 /100 | #106 | Exceptional 20.8% |
| Immigrants from Germany | 97.4 /100 | #107 | Exceptional 20.8% |
| Immigrants from Scotland | 97.1 /100 | #108 | Exceptional 20.8% |
| Filipinos | 97.0 /100 | #109 | Exceptional 20.8% |
| Asians | 96.8 /100 | #110 | Exceptional 20.8% |
| Immigrants from Micronesia | 96.7 /100 | #111 | Exceptional 20.7% |
| Nicaraguans | 96.2 /100 | #112 | Exceptional 20.7% |
Austrian 3 or more Vehicles in Household Correlation Summary
| Measurement | Austrian Data | 3 or more Vehicles in Household Data |
| Minimum | 0.17% | 3.1% |
| Maximum | 47.2% | 100.0% |
| Range | 47.1% | 96.9% |
| Mean | 15.3% | 33.7% |
| Median | 12.7% | 26.2% |
| Interquartile 25% (IQ1) | 6.0% | 22.8% |
| Interquartile 75% (IQ3) | 22.0% | 38.0% |
| Interquartile Range (IQR) | 16.0% | 15.2% |
| Standard Deviation (Sample) | 11.6% | 21.3% |
| Standard Deviation (Population) | 11.5% | 21.1% |
Correlation Details
| Austrian Percentile | Sample Size | 3 or more Vehicles in Household |
[ 0.0% - 0.5% ] 0.17% | 406,279,297 | 20.6% |
[ 0.5% - 1.0% ] 0.67% | 36,453,951 | 20.4% |
[ 1.0% - 1.5% ] 1.20% | 6,143,774 | 21.6% |
[ 1.5% - 2.0% ] 1.70% | 1,579,761 | 22.9% |
[ 2.0% - 2.5% ] 2.20% | 470,697 | 23.8% |
[ 2.5% - 3.0% ] 2.70% | 273,966 | 25.3% |
[ 3.0% - 3.5% ] 3.20% | 133,059 | 25.0% |
[ 3.5% - 4.0% ] 3.71% | 106,131 | 29.2% |
[ 4.0% - 4.5% ] 4.18% | 73,997 | 23.4% |
[ 4.5% - 5.0% ] 4.79% | 28,779 | 24.8% |
[ 5.0% - 5.5% ] 5.23% | 18,941 | 30.2% |
[ 5.5% - 6.0% ] 5.77% | 12,235 | 26.2% |
[ 6.0% - 6.5% ] 6.25% | 13,656 | 22.5% |
[ 6.5% - 7.0% ] 6.75% | 7,420 | 34.3% |
[ 7.0% - 7.5% ] 7.29% | 10,539 | 29.1% |
[ 7.5% - 8.0% ] 7.79% | 7,471 | 29.9% |
[ 8.0% - 8.5% ] 8.27% | 1,294 | 29.5% |
[ 8.5% - 9.0% ] 8.78% | 3,339 | 37.8% |
[ 9.0% - 9.5% ] 9.26% | 1,491 | 35.8% |
[ 9.5% - 10.0% ] 9.63% | 4,207 | 38.6% |
[ 10.0% - 10.5% ] 10.20% | 3,725 | 26.1% |
[ 10.5% - 11.0% ] 10.89% | 3,765 | 24.3% |
[ 11.0% - 11.5% ] 11.19% | 1,171 | 20.1% |
[ 12.0% - 12.5% ] 12.22% | 1,056 | 36.6% |
[ 12.5% - 13.0% ] 12.68% | 5,993 | 27.3% |
[ 13.0% - 13.5% ] 13.28% | 580 | 22.8% |
[ 13.5% - 14.0% ] 13.68% | 117 | 45.3% |
[ 14.5% - 15.0% ] 14.84% | 1,294 | 38.7% |
[ 15.0% - 15.5% ] 15.15% | 99 | 25.0% |
[ 16.0% - 16.5% ] 16.38% | 2,802 | 19.6% |
[ 16.5% - 17.0% ] 16.67% | 12 | 57.1% |
[ 17.5% - 18.0% ] 17.88% | 179 | 3.1% |
[ 18.0% - 18.5% ] 18.14% | 397 | 23.4% |
[ 18.5% - 19.0% ] 18.64% | 59 | 23.8% |
[ 19.0% - 19.5% ] 19.31% | 378 | 7.6% |
[ 20.5% - 21.0% ] 20.81% | 620 | 33.0% |
[ 21.5% - 22.0% ] 21.74% | 46 | 90.0% |
[ 22.0% - 22.5% ] 22.22% | 72 | 16.4% |
[ 23.5% - 24.0% ] 23.95% | 526 | 38.3% |
[ 26.0% - 26.5% ] 26.04% | 192 | 8.5% |
[ 26.5% - 27.0% ] 26.84% | 652 | 46.6% |
[ 27.5% - 28.0% ] 27.59% | 29 | 100.0% |
[ 29.5% - 30.0% ] 29.70% | 101 | 27.3% |
[ 33.0% - 33.5% ] 33.33% | 108 | 25.0% |
[ 34.0% - 34.5% ] 34.38% | 32 | 66.7% |
[ 34.5% - 35.0% ] 34.78% | 23 | 53.3% |
[ 36.5% - 37.0% ] 36.84% | 19 | 80.0% |
[ 41.0% - 41.5% ] 41.40% | 215 | 100.0% |
[ 47.0% - 47.5% ] 47.22% | 36 | 14.3% |