Northern European Female Disability
COMPARE
Northern European
Select to Compare
Female Disability
Northern European Female Disability
12.3%
DISABILITY | FEMALES
27.5/ 100
METRIC RATING
193rd/ 347
METRIC RANK
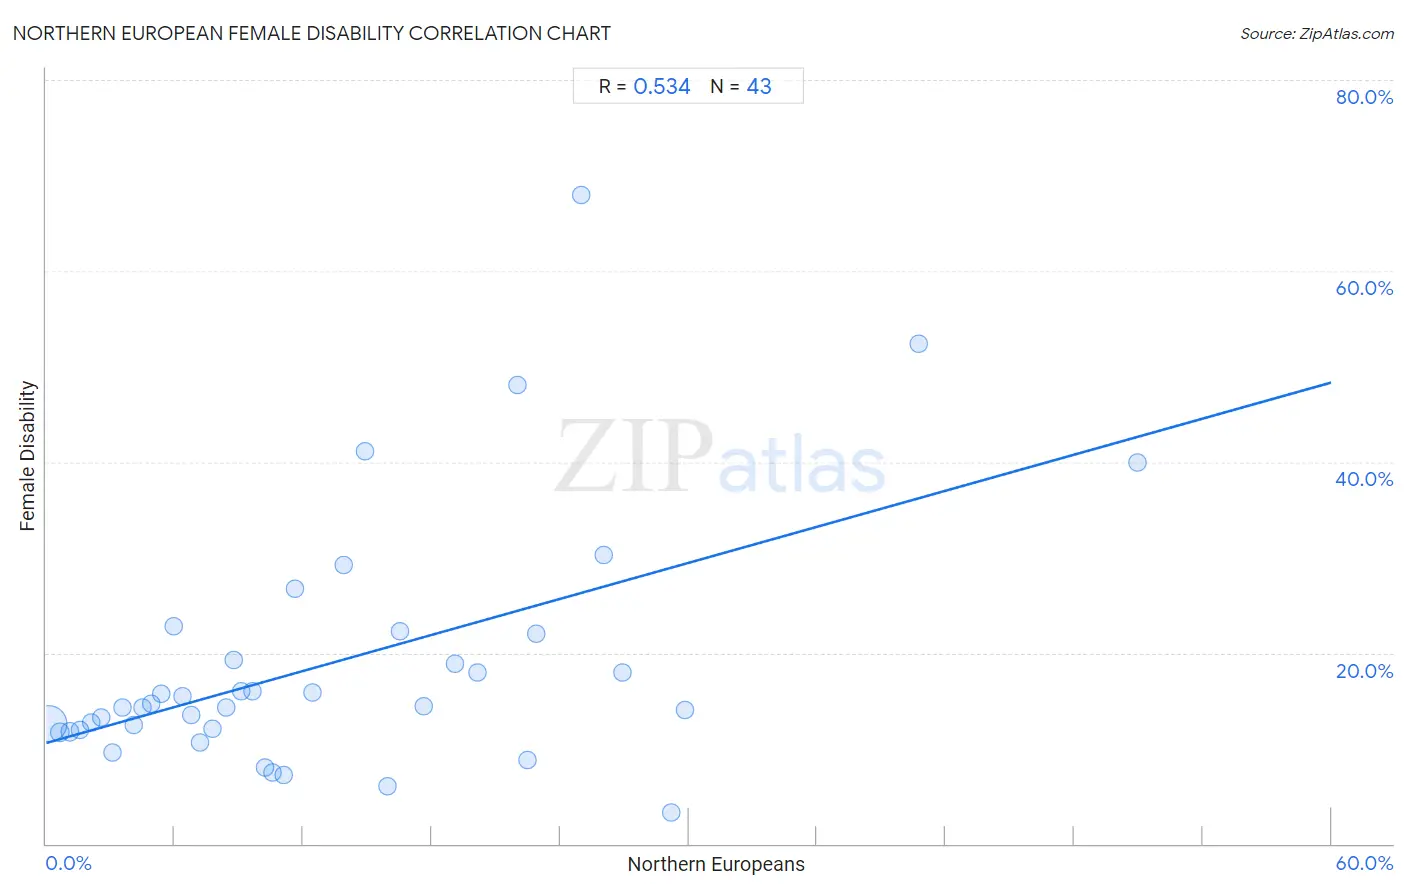
Northern European Female Disability Correlation Chart
The statistical analysis conducted on geographies consisting of 406,028,817 people shows a substantial positive correlation between the proportion of Northern Europeans and percentage of females with a disability in the United States with a correlation coefficient (R) of 0.534 and weighted average of 12.3%. On average, for every 1% (one percent) increase in Northern Europeans within a typical geography, there is an increase of 0.63% in percentage of females with a disability.
It is essential to understand that the correlation between the percentage of Northern Europeans and percentage of females with a disability does not imply a direct cause-and-effect relationship. It remains uncertain whether the presence of Northern Europeans influences an upward or downward trend in the level of percentage of females with a disability within an area, or if Northern Europeans simply ended up residing in those areas with higher or lower levels of percentage of females with a disability due to other factors.
Demographics Similar to Northern Europeans by Female Disability
In terms of female disability, the demographic groups most similar to Northern Europeans are Ukrainian (12.3%, a difference of 0.010%), Swedish (12.3%, a difference of 0.040%), Immigrants from Western Africa (12.3%, a difference of 0.080%), Armenian (12.3%, a difference of 0.10%), and Immigrants from Panama (12.3%, a difference of 0.10%).
| Demographics | Rating | Rank | Female Disability |
| Austrians | 33.3 /100 | #186 | Fair 12.3% |
| Serbians | 33.1 /100 | #187 | Fair 12.3% |
| Immigrants from North America | 32.8 /100 | #188 | Fair 12.3% |
| Immigrants from Albania | 31.6 /100 | #189 | Fair 12.3% |
| Immigrants from Honduras | 31.3 /100 | #190 | Fair 12.3% |
| Armenians | 29.7 /100 | #191 | Fair 12.3% |
| Immigrants from Western Africa | 29.2 /100 | #192 | Fair 12.3% |
| Northern Europeans | 27.5 /100 | #193 | Fair 12.3% |
| Ukrainians | 27.2 /100 | #194 | Fair 12.3% |
| Swedes | 26.6 /100 | #195 | Fair 12.3% |
| Immigrants from Panama | 25.5 /100 | #196 | Fair 12.3% |
| Hondurans | 25.4 /100 | #197 | Fair 12.3% |
| Mexican American Indians | 24.9 /100 | #198 | Fair 12.3% |
| Immigrants from Trinidad and Tobago | 24.7 /100 | #199 | Fair 12.3% |
| Trinidadians and Tobagonians | 22.4 /100 | #200 | Fair 12.3% |
Northern European Female Disability Correlation Summary
| Measurement | Northern European Data | Female Disability Data |
| Minimum | 0.15% | 3.3% |
| Maximum | 51.0% | 68.0% |
| Range | 50.8% | 64.7% |
| Mean | 13.3% | 18.9% |
| Median | 10.2% | 14.4% |
| Interquartile 25% (IQ1) | 4.9% | 12.0% |
| Interquartile 75% (IQ3) | 20.1% | 22.0% |
| Interquartile Range (IQR) | 15.2% | 10.0% |
| Standard Deviation (Sample) | 11.2% | 13.1% |
| Standard Deviation (Population) | 11.0% | 13.0% |
Correlation Details
| Northern European Percentile | Sample Size | Female Disability |
[ 0.0% - 0.5% ] 0.15% | 366,539,910 | 12.5% |
[ 0.5% - 1.0% ] 0.64% | 31,297,118 | 11.6% |
[ 1.0% - 1.5% ] 1.12% | 5,040,099 | 11.7% |
[ 1.5% - 2.0% ] 1.60% | 1,802,732 | 12.0% |
[ 2.0% - 2.5% ] 2.09% | 511,049 | 12.6% |
[ 2.5% - 3.0% ] 2.55% | 273,648 | 13.2% |
[ 3.0% - 3.5% ] 3.07% | 150,151 | 9.6% |
[ 3.5% - 4.0% ] 3.54% | 135,583 | 14.3% |
[ 4.0% - 4.5% ] 4.07% | 100,027 | 12.4% |
[ 4.0% - 4.5% ] 4.47% | 34,392 | 14.2% |
[ 4.5% - 5.0% ] 4.91% | 42,458 | 14.7% |
[ 5.0% - 5.5% ] 5.37% | 35,697 | 15.7% |
[ 5.5% - 6.0% ] 5.96% | 7,654 | 22.8% |
[ 6.0% - 6.5% ] 6.33% | 4,405 | 15.4% |
[ 6.5% - 7.0% ] 6.79% | 9,600 | 13.5% |
[ 7.0% - 7.5% ] 7.19% | 4,894 | 10.7% |
[ 7.5% - 8.0% ] 7.77% | 2,689 | 12.1% |
[ 8.0% - 8.5% ] 8.40% | 4,083 | 14.3% |
[ 8.5% - 9.0% ] 8.74% | 3,823 | 19.3% |
[ 9.0% - 9.5% ] 9.08% | 2,897 | 16.0% |
[ 9.5% - 10.0% ] 9.62% | 2,433 | 16.0% |
[ 10.0% - 10.5% ] 10.22% | 2,045 | 7.9% |
[ 10.5% - 11.0% ] 10.57% | 3,178 | 7.5% |
[ 11.0% - 11.5% ] 11.10% | 3,127 | 7.1% |
[ 11.5% - 12.0% ] 11.59% | 2,874 | 26.7% |
[ 12.0% - 12.5% ] 12.45% | 1,807 | 15.8% |
[ 13.5% - 14.0% ] 13.88% | 1,189 | 29.3% |
[ 14.5% - 15.0% ] 14.86% | 276 | 41.1% |
[ 15.5% - 16.0% ] 15.93% | 1,067 | 6.1% |
[ 16.5% - 17.0% ] 16.53% | 1,204 | 22.3% |
[ 17.5% - 18.0% ] 17.61% | 1,198 | 14.4% |
[ 19.0% - 19.5% ] 19.07% | 813 | 18.8% |
[ 20.0% - 20.5% ] 20.14% | 422 | 18.0% |
[ 22.0% - 22.5% ] 22.03% | 454 | 48.0% |
[ 22.0% - 22.5% ] 22.47% | 1,286 | 8.8% |
[ 22.5% - 23.0% ] 22.89% | 249 | 22.0% |
[ 25.0% - 25.5% ] 25.00% | 68 | 68.0% |
[ 26.0% - 26.5% ] 26.05% | 906 | 30.2% |
[ 26.5% - 27.0% ] 26.92% | 78 | 17.9% |
[ 29.0% - 29.5% ] 29.20% | 565 | 3.3% |
[ 29.5% - 30.0% ] 29.83% | 352 | 14.1% |
[ 40.5% - 41.0% ] 40.74% | 54 | 52.4% |
[ 50.5% - 51.0% ] 50.95% | 263 | 39.9% |