British Female Disability
COMPARE
British
Select to Compare
Female Disability
British Female Disability
12.4%
DISABILITY | FEMALES
12.7/ 100
METRIC RATING
217th/ 347
METRIC RANK
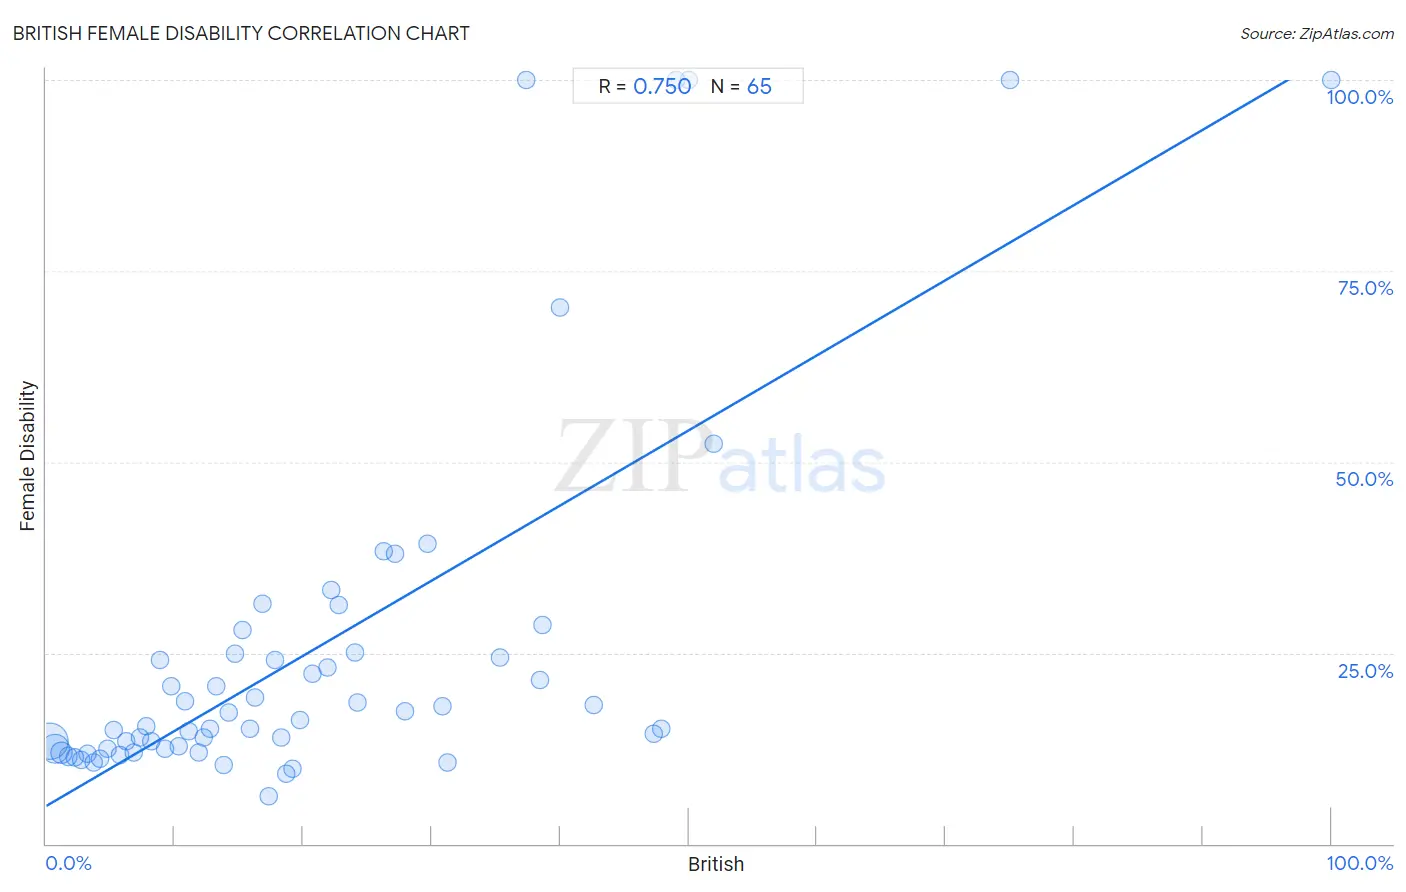
British Female Disability Correlation Chart
The statistical analysis conducted on geographies consisting of 531,338,456 people shows a strong positive correlation between the proportion of British and percentage of females with a disability in the United States with a correlation coefficient (R) of 0.750 and weighted average of 12.4%. On average, for every 1% (one percent) increase in British within a typical geography, there is an increase of 0.98% in percentage of females with a disability.
It is essential to understand that the correlation between the percentage of British and percentage of females with a disability does not imply a direct cause-and-effect relationship. It remains uncertain whether the presence of British influences an upward or downward trend in the level of percentage of females with a disability within an area, or if British simply ended up residing in those areas with higher or lower levels of percentage of females with a disability due to other factors.
Demographics Similar to British by Female Disability
In terms of female disability, the demographic groups most similar to British are Immigrants from Bahamas (12.4%, a difference of 0.020%), Immigrants from Burma/Myanmar (12.4%, a difference of 0.050%), European (12.4%, a difference of 0.050%), Panamanian (12.4%, a difference of 0.060%), and Samoan (12.4%, a difference of 0.060%).
| Demographics | Rating | Rank | Female Disability |
| Swiss | 14.9 /100 | #210 | Poor 12.4% |
| Immigrants from Bosnia and Herzegovina | 14.8 /100 | #211 | Poor 12.4% |
| Ute | 14.7 /100 | #212 | Poor 12.4% |
| Immigrants from Thailand | 14.5 /100 | #213 | Poor 12.4% |
| Panamanians | 13.5 /100 | #214 | Poor 12.4% |
| Samoans | 13.4 /100 | #215 | Poor 12.4% |
| Immigrants from Burma/Myanmar | 13.3 /100 | #216 | Poor 12.4% |
| British | 12.7 /100 | #217 | Poor 12.4% |
| Immigrants from Bahamas | 12.5 /100 | #218 | Poor 12.4% |
| Europeans | 12.1 /100 | #219 | Poor 12.4% |
| Bahamians | 11.1 /100 | #220 | Poor 12.4% |
| Native Hawaiians | 10.8 /100 | #221 | Poor 12.4% |
| Italians | 10.7 /100 | #222 | Poor 12.4% |
| Guamanians/Chamorros | 9.5 /100 | #223 | Tragic 12.5% |
| Belizeans | 9.3 /100 | #224 | Tragic 12.5% |
British Female Disability Correlation Summary
| Measurement | British Data | Female Disability Data |
| Minimum | 0.26% | 6.2% |
| Maximum | 100.0% | 100.0% |
| Range | 99.7% | 93.8% |
| Mean | 21.0% | 25.6% |
| Median | 16.2% | 16.2% |
| Interquartile 25% (IQ1) | 8.0% | 12.4% |
| Interquartile 75% (IQ3) | 28.8% | 25.0% |
| Interquartile Range (IQR) | 20.8% | 12.6% |
| Standard Deviation (Sample) | 18.4% | 24.1% |
| Standard Deviation (Population) | 18.3% | 23.9% |
Correlation Details
| British Percentile | Sample Size | Female Disability |
[ 0.0% - 0.5% ] 0.26% | 285,711,418 | 13.4% |
[ 0.5% - 1.0% ] 0.71% | 172,292,703 | 12.4% |
[ 1.0% - 1.5% ] 1.20% | 49,868,941 | 11.9% |
[ 1.5% - 2.0% ] 1.70% | 13,981,112 | 11.4% |
[ 2.0% - 2.5% ] 2.22% | 4,974,605 | 11.3% |
[ 2.5% - 3.0% ] 2.73% | 2,088,429 | 10.9% |
[ 3.0% - 3.5% ] 3.23% | 804,124 | 11.7% |
[ 3.5% - 4.0% ] 3.74% | 644,762 | 10.6% |
[ 4.0% - 4.5% ] 4.19% | 360,690 | 11.1% |
[ 4.5% - 5.0% ] 4.73% | 149,532 | 12.4% |
[ 5.0% - 5.5% ] 5.30% | 81,665 | 14.9% |
[ 5.5% - 6.0% ] 5.78% | 57,115 | 11.7% |
[ 6.0% - 6.5% ] 6.22% | 51,848 | 13.5% |
[ 6.5% - 7.0% ] 6.76% | 49,177 | 12.0% |
[ 7.0% - 7.5% ] 7.26% | 46,119 | 13.9% |
[ 7.5% - 8.0% ] 7.74% | 36,457 | 15.3% |
[ 8.0% - 8.5% ] 8.19% | 39,318 | 13.4% |
[ 8.5% - 9.0% ] 8.83% | 20,957 | 24.0% |
[ 9.0% - 9.5% ] 9.24% | 13,084 | 12.4% |
[ 9.5% - 10.0% ] 9.75% | 6,198 | 20.7% |
[ 10.0% - 10.5% ] 10.28% | 12,567 | 12.8% |
[ 10.5% - 11.0% ] 10.80% | 7,611 | 18.6% |
[ 11.0% - 11.5% ] 11.09% | 2,497 | 14.7% |
[ 11.5% - 12.0% ] 11.85% | 4,978 | 12.0% |
[ 12.0% - 12.5% ] 12.26% | 2,121 | 14.0% |
[ 12.5% - 13.0% ] 12.71% | 2,321 | 15.1% |
[ 13.0% - 13.5% ] 13.22% | 4,661 | 20.6% |
[ 13.5% - 14.0% ] 13.83% | 1,077 | 10.3% |
[ 14.0% - 14.5% ] 14.22% | 4,333 | 17.2% |
[ 14.5% - 15.0% ] 14.70% | 925 | 24.9% |
[ 15.0% - 15.5% ] 15.32% | 581 | 28.0% |
[ 15.5% - 16.0% ] 15.84% | 3,422 | 15.1% |
[ 16.0% - 16.5% ] 16.25% | 4,647 | 19.1% |
[ 16.5% - 17.0% ] 16.86% | 439 | 31.4% |
[ 17.0% - 17.5% ] 17.29% | 133 | 6.2% |
[ 17.5% - 18.0% ] 17.77% | 242 | 24.0% |
[ 18.0% - 18.5% ] 18.33% | 884 | 13.8% |
[ 18.5% - 19.0% ] 18.70% | 679 | 9.2% |
[ 19.0% - 19.5% ] 19.13% | 1,474 | 9.9% |
[ 19.5% - 20.0% ] 19.70% | 203 | 16.2% |
[ 20.5% - 21.0% ] 20.76% | 342 | 22.3% |
[ 21.5% - 22.0% ] 21.90% | 210 | 23.1% |
[ 22.0% - 22.5% ] 22.17% | 442 | 33.3% |
[ 22.5% - 23.0% ] 22.78% | 237 | 31.3% |
[ 24.0% - 24.5% ] 24.00% | 25 | 25.0% |
[ 24.0% - 24.5% ] 24.22% | 128 | 18.5% |
[ 26.0% - 26.5% ] 26.27% | 316 | 38.3% |
[ 27.0% - 27.5% ] 27.18% | 309 | 38.0% |
[ 27.5% - 28.0% ] 27.92% | 745 | 17.4% |
[ 29.5% - 30.0% ] 29.66% | 118 | 39.3% |
[ 30.5% - 31.0% ] 30.81% | 185 | 18.1% |
[ 31.0% - 31.5% ] 31.20% | 125 | 10.7% |
[ 35.0% - 35.5% ] 35.29% | 51 | 24.3% |
[ 37.0% - 37.5% ] 37.37% | 99 | 100.0% |
[ 38.0% - 38.5% ] 38.46% | 39 | 21.4% |
[ 38.5% - 39.0% ] 38.60% | 57 | 28.6% |
[ 40.0% - 40.5% ] 40.00% | 135 | 70.2% |
[ 42.5% - 43.0% ] 42.65% | 68 | 18.2% |
[ 47.0% - 47.5% ] 47.26% | 347 | 14.5% |
[ 47.5% - 48.0% ] 47.83% | 69 | 15.0% |
[ 48.5% - 49.0% ] 48.98% | 49 | 100.0% |
[ 50.0% - 50.5% ] 50.00% | 50 | 100.0% |
[ 51.5% - 52.0% ] 51.95% | 154 | 52.4% |
[ 75.0% - 75.5% ] 75.00% | 44 | 100.0% |
[ 99.5% - 100.0% ] 100.00% | 63 | 100.0% |