Austrian Disability Age 5 to 17
COMPARE
Austrian
Select to Compare
Disability Age 5 to 17
Austrian Disability Age 5 to 17
5.7%
DISABILITY | AGE 5 TO 17
13.2/ 100
METRIC RATING
202nd/ 347
METRIC RANK
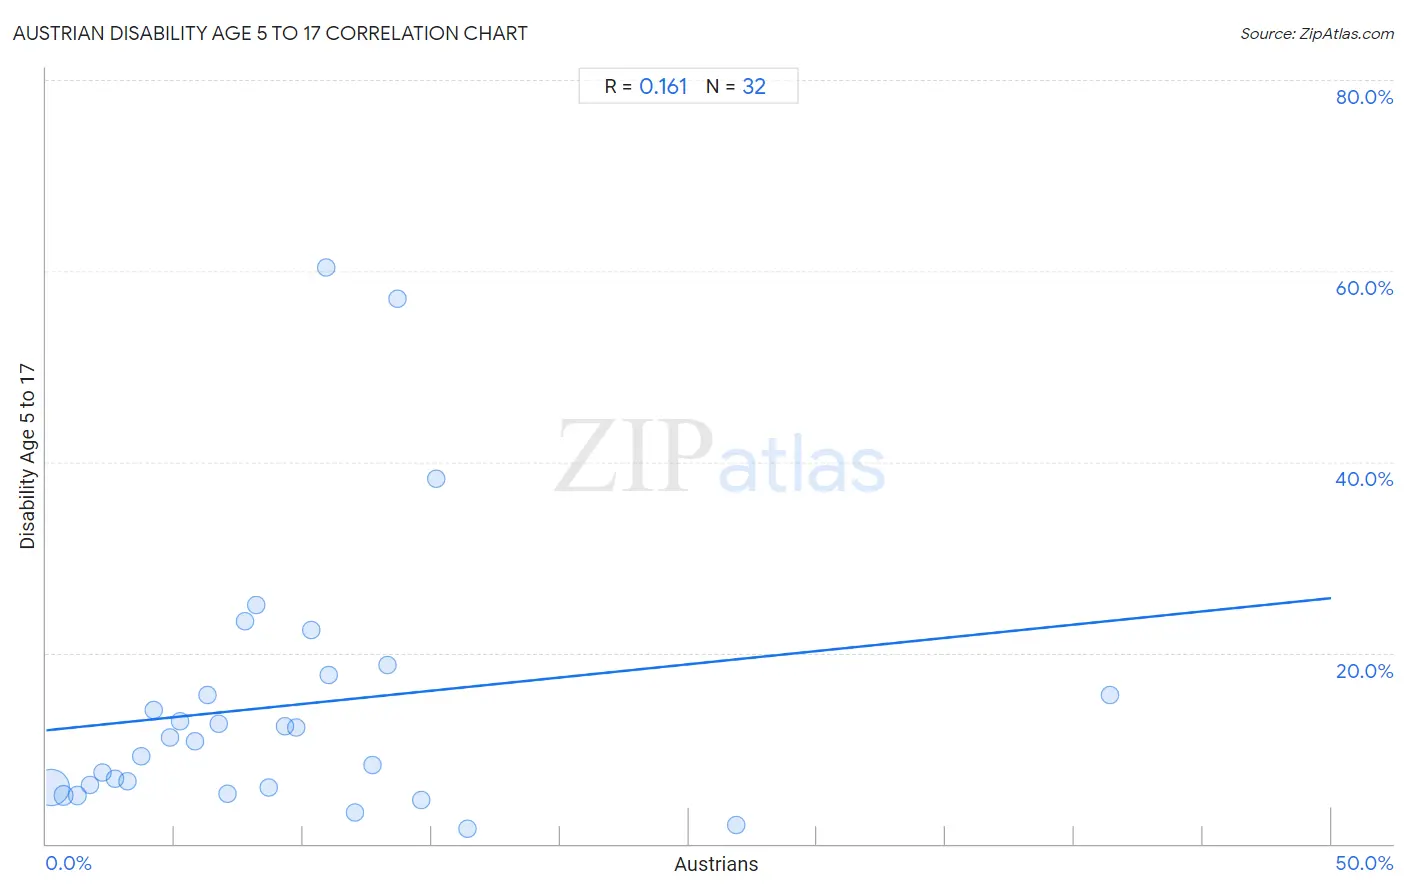
Austrian Disability Age 5 to 17 Correlation Chart
The statistical analysis conducted on geographies consisting of 446,287,500 people shows a poor positive correlation between the proportion of Austrians and percentage of population with a disability between the ages 5 and 17 in the United States with a correlation coefficient (R) of 0.161 and weighted average of 5.7%. On average, for every 1% (one percent) increase in Austrians within a typical geography, there is an increase of 0.28% in percentage of population with a disability between the ages 5 and 17.
It is essential to understand that the correlation between the percentage of Austrians and percentage of population with a disability between the ages 5 and 17 does not imply a direct cause-and-effect relationship. It remains uncertain whether the presence of Austrians influences an upward or downward trend in the level of percentage of population with a disability between the ages 5 and 17 within an area, or if Austrians simply ended up residing in those areas with higher or lower levels of percentage of population with a disability between the ages 5 and 17 due to other factors.
Demographics Similar to Austrians by Disability Age 5 to 17
In terms of disability age 5 to 17, the demographic groups most similar to Austrians are Spanish American Indian (5.7%, a difference of 0.040%), Basque (5.7%, a difference of 0.050%), Icelander (5.7%, a difference of 0.14%), Northern European (5.7%, a difference of 0.20%), and Paiute (5.7%, a difference of 0.22%).
| Demographics | Rating | Rank | Disability Age 5 to 17 |
| Immigrants from Nigeria | 23.4 /100 | #195 | Fair 5.7% |
| Inupiat | 23.3 /100 | #196 | Fair 5.7% |
| Immigrants from North America | 23.1 /100 | #197 | Fair 5.7% |
| Norwegians | 20.9 /100 | #198 | Fair 5.7% |
| Northern Europeans | 15.2 /100 | #199 | Poor 5.7% |
| Icelanders | 14.6 /100 | #200 | Poor 5.7% |
| Basques | 13.7 /100 | #201 | Poor 5.7% |
| Austrians | 13.2 /100 | #202 | Poor 5.7% |
| Spanish American Indians | 12.8 /100 | #203 | Poor 5.7% |
| Paiute | 11.2 /100 | #204 | Poor 5.7% |
| Trinidadians and Tobagonians | 10.8 /100 | #205 | Poor 5.7% |
| Immigrants from Africa | 10.8 /100 | #206 | Poor 5.7% |
| Moroccans | 10.4 /100 | #207 | Poor 5.7% |
| Kenyans | 10.0 /100 | #208 | Poor 5.8% |
| Immigrants from Uganda | 9.7 /100 | #209 | Tragic 5.8% |
Austrian Disability Age 5 to 17 Correlation Summary
| Measurement | Austrian Data | Disability Age 5 to 17 Data |
| Minimum | 0.17% | 1.5% |
| Maximum | 41.4% | 60.4% |
| Range | 41.2% | 58.9% |
| Mean | 9.3% | 14.5% |
| Median | 8.0% | 10.9% |
| Interquartile 25% (IQ1) | 3.9% | 5.9% |
| Interquartile 75% (IQ3) | 12.4% | 16.6% |
| Interquartile Range (IQR) | 8.4% | 10.8% |
| Standard Deviation (Sample) | 8.1% | 14.0% |
| Standard Deviation (Population) | 8.0% | 13.8% |
Correlation Details
| Austrian Percentile | Sample Size | Disability Age 5 to 17 |
[ 0.0% - 0.5% ] 0.17% | 403,341,376 | 5.9% |
[ 0.5% - 1.0% ] 0.66% | 35,016,085 | 5.0% |
[ 1.0% - 1.5% ] 1.19% | 5,629,072 | 5.1% |
[ 1.5% - 2.0% ] 1.70% | 1,415,909 | 6.1% |
[ 2.0% - 2.5% ] 2.20% | 388,419 | 7.4% |
[ 2.5% - 3.0% ] 2.70% | 215,302 | 6.8% |
[ 3.0% - 3.5% ] 3.15% | 69,841 | 6.5% |
[ 3.5% - 4.0% ] 3.71% | 81,776 | 9.1% |
[ 4.0% - 4.5% ] 4.17% | 52,785 | 14.0% |
[ 4.5% - 5.0% ] 4.80% | 20,014 | 11.1% |
[ 5.0% - 5.5% ] 5.20% | 13,175 | 12.9% |
[ 5.5% - 6.0% ] 5.77% | 10,240 | 10.8% |
[ 6.0% - 6.5% ] 6.26% | 10,667 | 15.6% |
[ 6.5% - 7.0% ] 6.73% | 4,009 | 12.6% |
[ 7.0% - 7.5% ] 7.06% | 1,812 | 5.2% |
[ 7.5% - 8.0% ] 7.75% | 2,608 | 23.4% |
[ 8.0% - 8.5% ] 8.16% | 196 | 25.0% |
[ 8.5% - 9.0% ] 8.65% | 682 | 5.9% |
[ 9.0% - 9.5% ] 9.28% | 1,045 | 12.3% |
[ 9.5% - 10.0% ] 9.73% | 555 | 12.2% |
[ 10.0% - 10.5% ] 10.29% | 729 | 22.4% |
[ 10.5% - 11.0% ] 10.91% | 541 | 60.4% |
[ 11.0% - 11.5% ] 11.01% | 227 | 17.6% |
[ 12.0% - 12.5% ] 12.04% | 457 | 3.2% |
[ 12.5% - 13.0% ] 12.68% | 5,993 | 8.3% |
[ 13.0% - 13.5% ] 13.26% | 377 | 18.8% |
[ 13.5% - 14.0% ] 13.68% | 117 | 57.1% |
[ 14.5% - 15.0% ] 14.62% | 130 | 4.5% |
[ 15.0% - 15.5% ] 15.15% | 99 | 38.2% |
[ 16.0% - 16.5% ] 16.41% | 2,395 | 1.5% |
[ 26.5% - 27.0% ] 26.84% | 652 | 2.0% |
[ 41.0% - 41.5% ] 41.40% | 215 | 15.6% |