Paiute Female Disability
COMPARE
Paiute
Select to Compare
Female Disability
Paiute Female Disability
14.0%
DISABILITY | FEMALES
0.0/ 100
METRIC RATING
318th/ 347
METRIC RANK
Paiute Female Disability Correlation Chart
The statistical analysis conducted on geographies consisting of 58,394,614 people shows a weak negative correlation between the proportion of Paiute and percentage of females with a disability in the United States with a correlation coefficient (R) of -0.227 and weighted average of 14.0%. On average, for every 1% (one percent) increase in Paiute within a typical geography, there is a decrease of 0.073% in percentage of females with a disability.
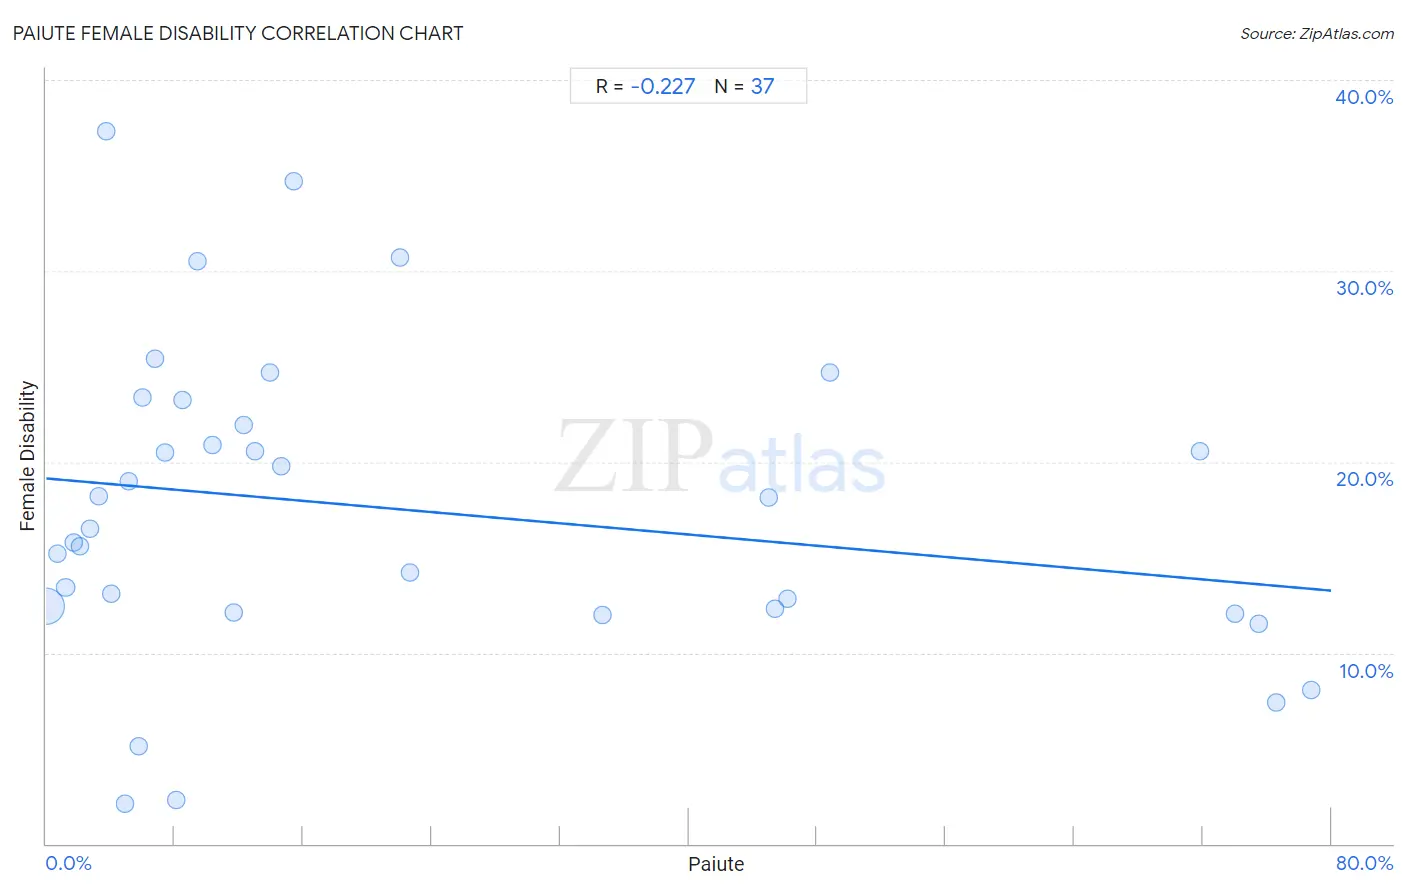
It is essential to understand that the correlation between the percentage of Paiute and percentage of females with a disability does not imply a direct cause-and-effect relationship. It remains uncertain whether the presence of Paiute influences an upward or downward trend in the level of percentage of females with a disability within an area, or if Paiute simply ended up residing in those areas with higher or lower levels of percentage of females with a disability due to other factors.
Demographics Similar to Paiute by Female Disability
In terms of female disability, the demographic groups most similar to Paiute are Chippewa (14.0%, a difference of 0.11%), Spanish American (14.0%, a difference of 0.22%), Iroquois (14.0%, a difference of 0.29%), Alaskan Athabascan (13.9%, a difference of 0.58%), and American (14.1%, a difference of 0.63%).
| Demographics | Rating | Rank | Female Disability |
| Hopi | 0.0 /100 | #311 | Tragic 13.7% |
| Delaware | 0.0 /100 | #312 | Tragic 13.8% |
| Blackfeet | 0.0 /100 | #313 | Tragic 13.8% |
| Puget Sound Salish | 0.0 /100 | #314 | Tragic 13.8% |
| Alaskan Athabascans | 0.0 /100 | #315 | Tragic 13.9% |
| Spanish Americans | 0.0 /100 | #316 | Tragic 14.0% |
| Chippewa | 0.0 /100 | #317 | Tragic 14.0% |
| Paiute | 0.0 /100 | #318 | Tragic 14.0% |
| Iroquois | 0.0 /100 | #319 | Tragic 14.0% |
| Americans | 0.0 /100 | #320 | Tragic 14.1% |
| Potawatomi | 0.0 /100 | #321 | Tragic 14.1% |
| Pueblo | 0.0 /100 | #322 | Tragic 14.1% |
| Blacks/African Americans | 0.0 /100 | #323 | Tragic 14.1% |
| Natives/Alaskans | 0.0 /100 | #324 | Tragic 14.1% |
| Navajo | 0.0 /100 | #325 | Tragic 14.2% |
Paiute Female Disability Correlation Summary
| Measurement | Paiute Data | Female Disability Data |
| Minimum | 0.030% | 2.1% |
| Maximum | 78.7% | 37.3% |
| Range | 78.7% | 35.2% |
| Mean | 22.0% | 17.5% |
| Median | 10.3% | 16.5% |
| Interquartile 25% (IQ1) | 4.5% | 12.2% |
| Interquartile 75% (IQ3) | 39.8% | 22.6% |
| Interquartile Range (IQR) | 35.3% | 10.3% |
| Standard Deviation (Sample) | 25.3% | 8.2% |
| Standard Deviation (Population) | 24.9% | 8.1% |
Correlation Details
| Paiute Percentile | Sample Size | Female Disability |
[ 0.0% - 0.5% ] 0.030% | 57,644,571 | 12.5% |
[ 0.5% - 1.0% ] 0.68% | 496,622 | 15.2% |
[ 1.0% - 1.5% ] 1.20% | 147,601 | 13.4% |
[ 1.5% - 2.0% ] 1.75% | 29,125 | 15.8% |
[ 2.0% - 2.5% ] 2.12% | 8,780 | 15.6% |
[ 2.5% - 3.0% ] 2.74% | 9,328 | 16.5% |
[ 3.0% - 3.5% ] 3.28% | 579 | 18.2% |
[ 3.5% - 4.0% ] 3.76% | 1,916 | 37.3% |
[ 4.0% - 4.5% ] 4.04% | 15,901 | 13.1% |
[ 4.5% - 5.0% ] 4.92% | 1,565 | 2.1% |
[ 5.0% - 5.5% ] 5.12% | 6,295 | 19.0% |
[ 5.5% - 6.0% ] 5.74% | 1,133 | 5.1% |
[ 6.0% - 6.5% ] 6.02% | 3,108 | 23.4% |
[ 6.5% - 7.0% ] 6.80% | 8,472 | 25.4% |
[ 7.0% - 7.5% ] 7.39% | 1,705 | 20.5% |
[ 8.0% - 8.5% ] 8.09% | 408 | 2.3% |
[ 8.5% - 9.0% ] 8.52% | 775 | 23.3% |
[ 9.0% - 9.5% ] 9.38% | 1,886 | 30.5% |
[ 10.0% - 10.5% ] 10.35% | 3,034 | 20.9% |
[ 11.5% - 12.0% ] 11.70% | 778 | 12.1% |
[ 12.0% - 12.5% ] 12.31% | 1,649 | 21.9% |
[ 12.5% - 13.0% ] 12.99% | 1,563 | 20.6% |
[ 13.5% - 14.0% ] 13.90% | 374 | 24.7% |
[ 14.5% - 15.0% ] 14.63% | 1,032 | 19.8% |
[ 15.0% - 15.5% ] 15.43% | 363 | 34.7% |
[ 22.0% - 22.5% ] 22.05% | 254 | 30.7% |
[ 22.5% - 23.0% ] 22.68% | 313 | 14.2% |
[ 34.5% - 35.0% ] 34.61% | 393 | 12.0% |
[ 44.5% - 45.0% ] 44.98% | 887 | 18.1% |
[ 45.0% - 45.5% ] 45.35% | 172 | 12.3% |
[ 46.0% - 46.5% ] 46.15% | 169 | 12.9% |
[ 48.5% - 49.0% ] 48.76% | 1,007 | 24.7% |
[ 71.5% - 72.0% ] 71.85% | 135 | 20.5% |
[ 73.5% - 74.0% ] 74.00% | 896 | 12.0% |
[ 75.0% - 75.5% ] 75.46% | 1,084 | 11.5% |
[ 76.5% - 77.0% ] 76.59% | 393 | 7.4% |
[ 78.5% - 79.0% ] 78.74% | 348 | 8.0% |