New Zealander vs Tohono O'odham 3 or more Vehicles in Household

COMPARE

New Zealander
Race
Ancestry
AfghanAfricanAlaska NativeAlaskan AthabascanAlbanianAleutAlsatianAmericanApacheArabArapahoArgentineanArmenianAssyrian/Chaldean/SyriacAustralianAustrianBahamianBangladeshiBarbadianBasqueBelgianBelizeanBermudanBhutaneseBlackfeetBolivianBrazilianBritishBritish West IndianBulgarianBurmeseCajunCambodianCanadianCape VerdeanCarpatho RusynCelticCentral AmericanCentral American IndianCherokeeCheyenneChickasawChileanChineseChippewaChoctawColombianColvilleComancheCosta RicanCreeCreekCroatianCrowCubanCypriotCzechCzechoslovakianDanishDelawareDominicanDutchDutch West IndianEastern EuropeanEcuadorianEgyptianEnglishEstonianEthiopianEuropeanFijianFilipinoFinnishFrenchFrench American IndianFrench CanadianGermanGerman RussianGhanaianGreekGuamanian/ChamorroGuatemalanGuyaneseHaitianHmongHonduranHopiHoumaHungarianIcelanderIndian (Asian)IndonesianInupiatIranianIraqiIrishIroquoisIsraeliItalianJamaicanJapaneseJordanianKenyanKiowaKoreanLaotianLatvianLebaneseLiberianLithuanianLumbeeLuxembourgerMacedonianMalaysianMalteseMarshalleseMenomineeMexicanMexican American IndianMongolianMoroccanNative HawaiianNavajoNepaleseNew ZealanderNicaraguanNigerianNorthern EuropeanNorwegianOkinawanOsageOttawaPaiutePakistaniPalestinianPanamanianParaguayanPennsylvania GermanPeruvianPimaPolishPortuguesePotawatomiPuebloPuerto RicanPuget Sound SalishRomanianRussianSalvadoranSamoanScandinavianScotch-IrishScottishSeminoleSenegaleseSerbianShoshoneSierra LeoneanSiouxSlavicSlovakSloveneSomaliSouth AfricanSouth AmericanSouth American IndianSoviet UnionSpaniardSpanishSpanish AmericanSpanish American IndianSri LankanSubsaharan AfricanSudaneseSwedishSwissSyrianTaiwaneseThaiTlingit-HaidaTonganTrinidadian and TobagonianTsimshianTurkishU.S. Virgin IslanderUgandanUkrainianUruguayanUteVenezuelanVietnameseWelshWest IndianYakamaYaquiYugoslavianYumanYup'ikZimbabwean
Immigration
NonimmigrantsImmigrantsAfghanistanAfricaAlbaniaArgentinaArmeniaAsiaAustraliaAustriaBahamasBangladeshBarbadosBelarusBelgiumBelizeBoliviaBosnia and HerzegovinaBrazilBulgariaBurma/MyanmarCabo VerdeCambodiaCameroonCanadaCaribbeanCentral AmericaChileChinaColombiaCongoCosta RicaCroatiaCubaCzechoslovakiaDenmarkDominicaDominican RepublicEastern AfricaEastern AsiaEastern EuropeEcuadorEgyptEl SalvadorEnglandEritreaEthiopiaEuropeFijiFranceGermanyGhanaGreeceGrenadaGuatemalaGuyanaHaitiHondurasHong KongHungaryIndiaIndonesiaIranIraqIrelandIsraelItalyJamaicaJapanJordanKazakhstanKenyaKoreaKuwaitLaosLatin AmericaLatviaLebanonLiberiaLithuaniaMalaysiaMexicoMicronesiaMiddle AfricaMoldovaMoroccoNepalNetherlandsNicaraguaNigeriaNorth AmericaNorth MacedoniaNorthern AfricaNorthern EuropeNorwayOceaniaPakistanPanamaPeruPhilippinesPolandPortugalRomaniaRussiaSaudi ArabiaScotlandSenegalSerbiaSierra LeoneSingaporeSomaliaSouth AfricaSouth AmericaSouth Central AsiaSouth Eastern AsiaSouthern EuropeSpainSri LankaSt. Vincent and the GrenadinesSudanSwedenSwitzerlandSyriaTaiwanThailandTrinidad and TobagoTurkeyUgandaUkraineUruguayUzbekistanVenezuelaVietnamWest IndiesWestern AfricaWestern AsiaWestern EuropeYemenZaireZimbabweAzores
Tohono O'odham
Race
Ancestry
AfghanAfricanAlaska NativeAlaskan AthabascanAlbanianAleutAlsatianAmericanApacheArabArapahoArgentineanArmenianAssyrian/Chaldean/SyriacAustralianAustrianBahamianBangladeshiBarbadianBasqueBelgianBelizeanBermudanBhutaneseBlackfeetBolivianBrazilianBritishBritish West IndianBulgarianBurmeseCajunCambodianCanadianCape VerdeanCarpatho RusynCelticCentral AmericanCentral American IndianCherokeeCheyenneChickasawChileanChineseChippewaChoctawColombianColvilleComancheCosta RicanCreeCreekCroatianCrowCubanCypriotCzechCzechoslovakianDanishDelawareDominicanDutchDutch West IndianEastern EuropeanEcuadorianEgyptianEnglishEstonianEthiopianEuropeanFijianFilipinoFinnishFrenchFrench American IndianFrench CanadianGermanGerman RussianGhanaianGreekGuamanian/ChamorroGuatemalanGuyaneseHaitianHmongHonduranHopiHoumaHungarianIcelanderIndian (Asian)IndonesianInupiatIranianIraqiIrishIroquoisIsraeliItalianJamaicanJapaneseJordanianKenyanKiowaKoreanLaotianLatvianLebaneseLiberianLithuanianLumbeeLuxembourgerMacedonianMalaysianMalteseMarshalleseMenomineeMexicanMexican American IndianMongolianMoroccanNative HawaiianNavajoNepaleseNicaraguanNigerianNorthern EuropeanNorwegianOkinawanOsageOttawaPaiutePakistaniPalestinianPanamanianParaguayanPennsylvania GermanPeruvianPimaPolishPortuguesePotawatomiPuebloPuerto RicanPuget Sound SalishRomanianRussianSalvadoranSamoanScandinavianScotch-IrishScottishSeminoleSenegaleseSerbianShoshoneSierra LeoneanSiouxSlavicSlovakSloveneSomaliSouth AfricanSouth AmericanSouth American IndianSoviet UnionSpaniardSpanishSpanish AmericanSpanish American IndianSri LankanSubsaharan AfricanSudaneseSwedishSwissSyrianTaiwaneseThaiTlingit-HaidaTohono O'OdhamTonganTrinidadian and TobagonianTsimshianTurkishU.S. Virgin IslanderUgandanUkrainianUruguayanUteVenezuelanVietnameseWelshWest IndianYakamaYaquiYugoslavianYumanYup'ikZimbabwean
Immigration
NonimmigrantsImmigrantsAfghanistanAfricaAlbaniaArgentinaArmeniaAsiaAustraliaAustriaBahamasBangladeshBarbadosBelarusBelgiumBelizeBoliviaBosnia and HerzegovinaBrazilBulgariaBurma/MyanmarCabo VerdeCambodiaCameroonCanadaCaribbeanCentral AmericaChileChinaColombiaCongoCosta RicaCroatiaCubaCzechoslovakiaDenmarkDominicaDominican RepublicEastern AfricaEastern AsiaEastern EuropeEcuadorEgyptEl SalvadorEnglandEritreaEthiopiaEuropeFijiFranceGermanyGhanaGreeceGrenadaGuatemalaGuyanaHaitiHondurasHong KongHungaryIndiaIndonesiaIranIraqIrelandIsraelItalyJamaicaJapanJordanKazakhstanKenyaKoreaKuwaitLaosLatin AmericaLatviaLebanonLiberiaLithuaniaMalaysiaMexicoMicronesiaMiddle AfricaMoldovaMoroccoNepalNetherlandsNicaraguaNigeriaNorth AmericaNorth MacedoniaNorthern AfricaNorthern EuropeNorwayOceaniaPakistanPanamaPeruPhilippinesPolandPortugalRomaniaRussiaSaudi ArabiaScotlandSenegalSerbiaSierra LeoneSingaporeSomaliaSouth AfricaSouth AmericaSouth Central AsiaSouth Eastern AsiaSouthern EuropeSpainSri LankaSt. Vincent and the GrenadinesSudanSwedenSwitzerlandSyriaTaiwanThailandTrinidad and TobagoTurkeyUgandaUkraineUruguayUzbekistanVenezuelaVietnamWest IndiesWestern AfricaWestern AsiaWestern EuropeYemenZaireZimbabweAzores
3 or more Vehicles in Household
Income
Poverty
Unemployment
Labor Participation
Family Structure
Vehicle Availability
Education Level
Disability

3 or more Vehicles in Household Comparison

New Zealanders

Tohono O'odham

Exceptional
Poor
20.4%
3 OR MORE VEHICLES IN HOUSEHOLD
91.3/ 100
METRIC RATING
128th/ 347
METRIC RANK
18.9%
3 OR MORE VEHICLES IN HOUSEHOLD
14.8/ 100
METRIC RATING
203rd/ 347
METRIC RANK

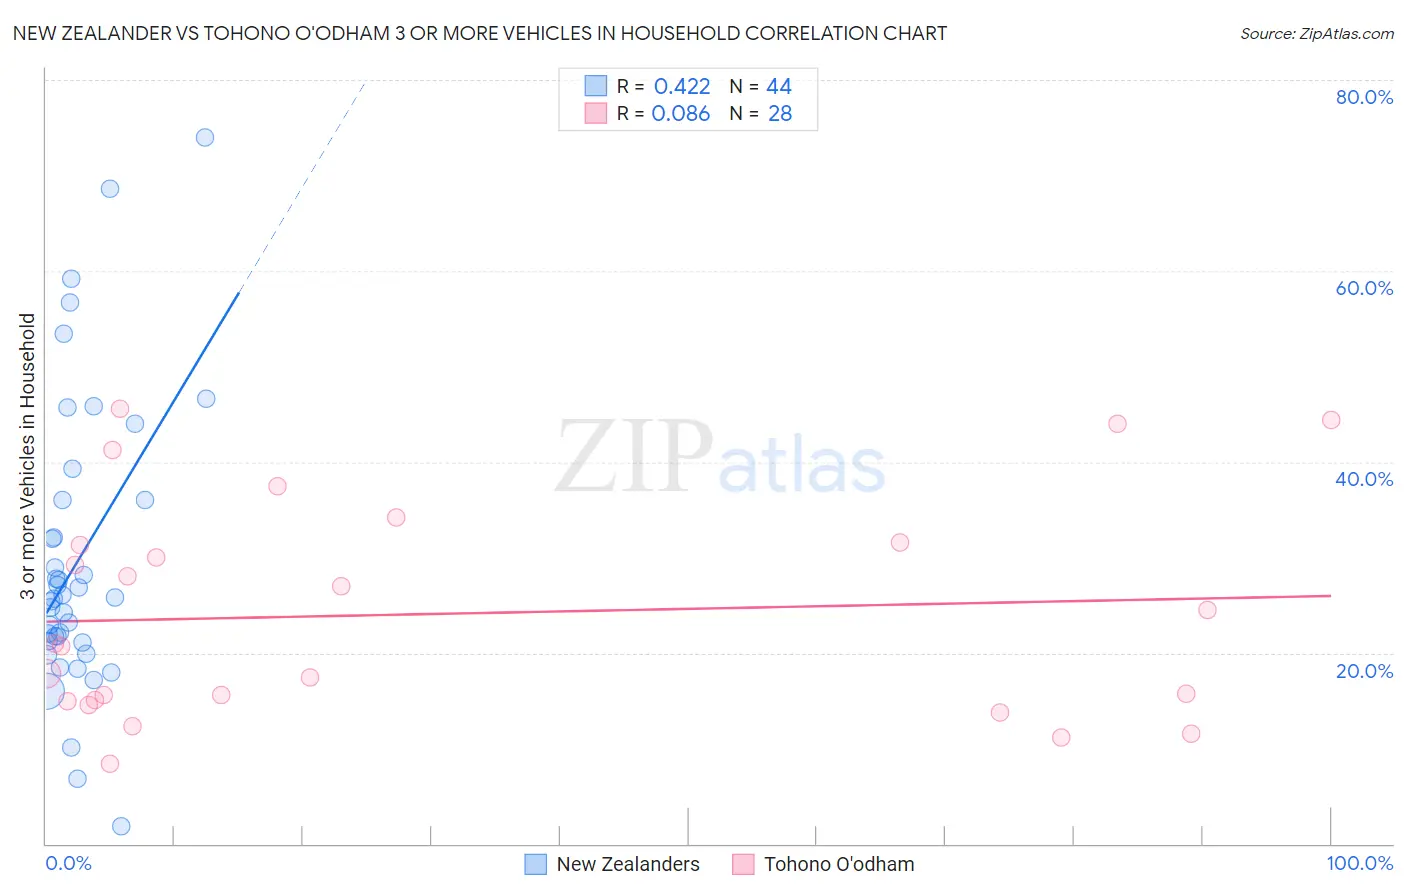
New Zealander vs Tohono O'odham 3 or more Vehicles in Household Correlation Chart

The statistical analysis conducted on geographies consisting of 106,882,673 people shows a moderate positive correlation between the proportion of New Zealanders and percentage of households with 3 or more vehicles available in the United States with a correlation coefficient (R) of 0.422 and weighted average of 20.4%. Similarly, the statistical analysis conducted on geographies consisting of 58,717,373 people shows a slight positive correlation between the proportion of Tohono O'odham and percentage of households with 3 or more vehicles available in the United States with a correlation coefficient (R) of 0.086 and weighted average of 18.9%, a difference of 8.0%.
New Zealander vs Tohono O'odham 3 or more Vehicles in Household

3 or more Vehicles in Household Correlation Summary

MeasurementNew ZealanderTohono O'odham
Minimum1.8%8.4%
Maximum74.0%45.6%
Range72.2%37.1%
Mean29.8%24.1%
Median25.7%20.8%
Interquartile 25% (IQ1)21.2%15.0%
Interquartile 75% (IQ3)36.1%31.4%
Interquartile Range (IQR)14.9%16.4%
Standard Deviation (Sample)15.3%11.3%
Standard Deviation (Population)15.1%11.1%

Similar Demographics by 3 or more Vehicles in Household

Demographics Similar to New Zealanders by 3 or more Vehicles in Household

In terms of 3 or more vehicles in household, the demographic groups most similar to New Zealanders are Immigrants from Bolivia (20.4%, a difference of 0.17%), Slavic (20.4%, a difference of 0.20%), Immigrants from Netherlands (20.4%, a difference of 0.41%), Central American (20.5%, a difference of 0.45%), and Zimbabwean (20.3%, a difference of 0.52%).
DemographicsRating | Rank3 or more Vehicles in Household
Immigrants | Thailand
93.8
/100
|
#121
Exceptional
20.5%
German Russians
93.7
/100
|
#122
Exceptional
20.5%
Immigrants | Korea
93.7
/100
|
#123
Exceptional
20.5%
Central Americans
93.1
/100
|
#124
Exceptional
20.5%
Immigrants | Netherlands
92.9
/100
|
#125
Exceptional
20.4%
Slavs
92.1
/100
|
#126
Exceptional
20.4%
Immigrants | Bolivia
92.0
/100
|
#127
Exceptional
20.4%
New Zealanders
91.3
/100
|
#128
Exceptional
20.4%
Zimbabweans
88.7
/100
|
#129
Excellent
20.3%
Greeks
88.6
/100
|
#130
Excellent
20.3%
Immigrants | Asia
88.1
/100
|
#131
Excellent
20.2%
Immigrants | Canada
87.8
/100
|
#132
Excellent
20.2%
Immigrants | North America
87.8
/100
|
#133
Excellent
20.2%
Poles
87.3
/100
|
#134
Excellent
20.2%
Immigrants | India
87.2
/100
|
#135
Excellent
20.2%

Demographics Similar to Tohono O'odham by 3 or more Vehicles in Household

In terms of 3 or more vehicles in household, the demographic groups most similar to Tohono O'odham are Immigrants from Romania (18.9%, a difference of 0.030%), Immigrants from Austria (18.9%, a difference of 0.090%), Russian (18.8%, a difference of 0.10%), Immigrants from Eastern Asia (18.8%, a difference of 0.11%), and Immigrants from Chile (18.8%, a difference of 0.19%).
DemographicsRating | Rank3 or more Vehicles in Household
Central American Indians
22.2
/100
|
#196
Fair
19.0%
Immigrants | Japan
22.0
/100
|
#197
Fair
19.0%
Egyptians
19.5
/100
|
#198
Poor
19.0%
Immigrants | Norway
19.0
/100
|
#199
Poor
19.0%
Argentineans
18.2
/100
|
#200
Poor
18.9%
Arabs
17.7
/100
|
#201
Poor
18.9%
Immigrants | Austria
15.4
/100
|
#202
Poor
18.9%
Tohono O'odham
14.8
/100
|
#203
Poor
18.9%
Immigrants | Romania
14.6
/100
|
#204
Poor
18.9%
Russians
14.2
/100
|
#205
Poor
18.8%
Immigrants | Eastern Asia
14.1
/100
|
#206
Poor
18.8%
Immigrants | Chile
13.6
/100
|
#207
Poor
18.8%
Immigrants | Burma/Myanmar
13.6
/100
|
#208
Poor
18.8%
Immigrants | Egypt
13.5
/100
|
#209
Poor
18.8%
Bulgarians
13.1
/100
|
#210
Poor
18.8%