New Zealander vs Apache 3 or more Vehicles in Household
COMPARE
New Zealander
Apache
3 or more Vehicles in Household
3 or more Vehicles in Household Comparison
New Zealanders
Apache
20.4%
3 OR MORE VEHICLES IN HOUSEHOLD
91.3/ 100
METRIC RATING
128th/ 347
METRIC RANK
21.2%
3 OR MORE VEHICLES IN HOUSEHOLD
98.9/ 100
METRIC RATING
92nd/ 347
METRIC RANK
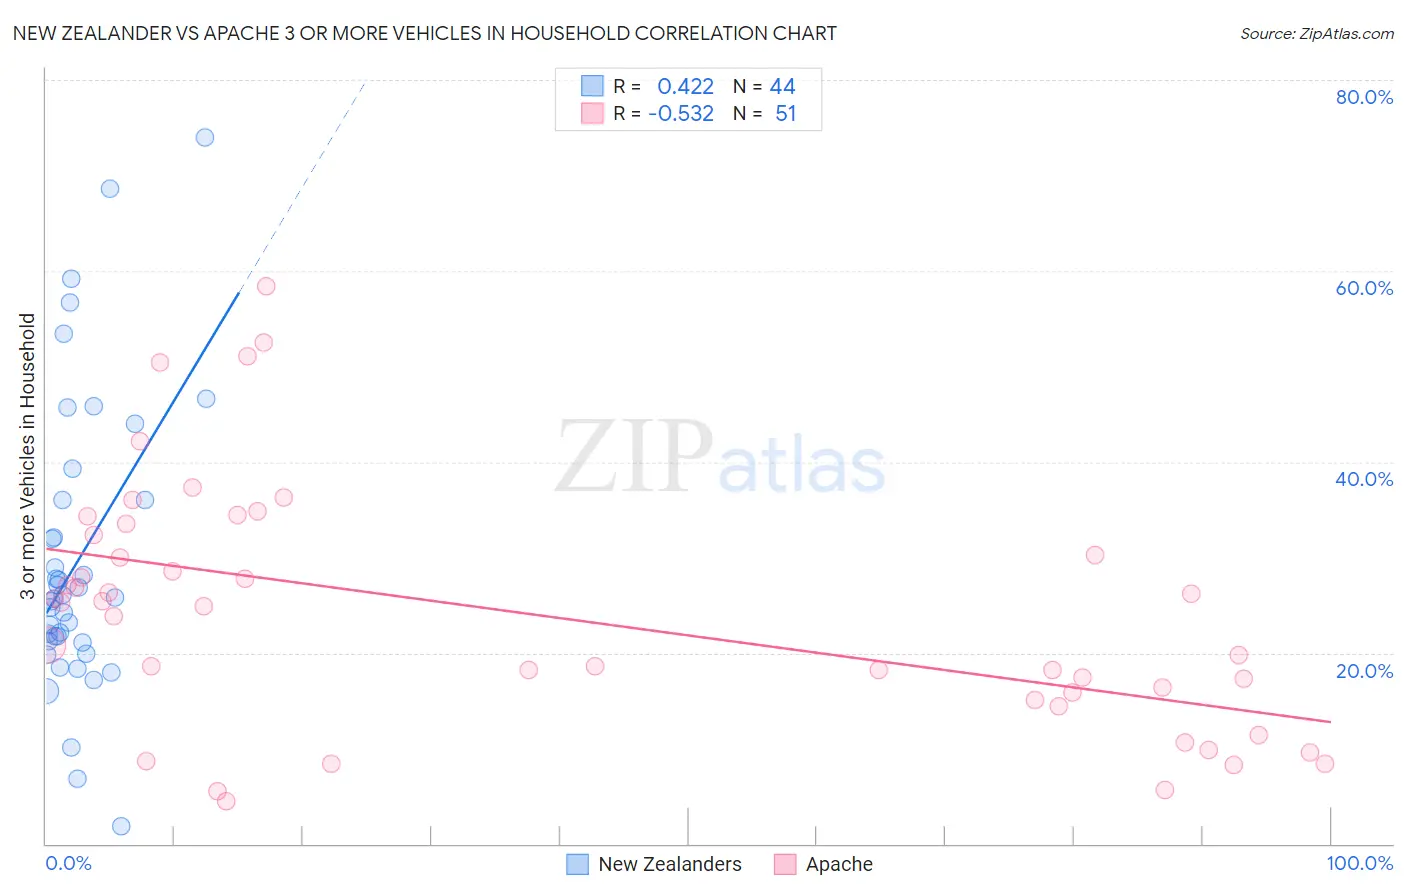
New Zealander vs Apache 3 or more Vehicles in Household Correlation Chart
The statistical analysis conducted on geographies consisting of 106,882,673 people shows a moderate positive correlation between the proportion of New Zealanders and percentage of households with 3 or more vehicles available in the United States with a correlation coefficient (R) of 0.422 and weighted average of 20.4%. Similarly, the statistical analysis conducted on geographies consisting of 231,026,513 people shows a substantial negative correlation between the proportion of Apache and percentage of households with 3 or more vehicles available in the United States with a correlation coefficient (R) of -0.532 and weighted average of 21.2%, a difference of 3.9%.
3 or more Vehicles in Household Correlation Summary
| Measurement | New Zealander | Apache |
| Minimum | 1.8% | 4.5% |
| Maximum | 74.0% | 58.3% |
| Range | 72.2% | 53.9% |
| Mean | 29.8% | 24.1% |
| Median | 25.7% | 24.8% |
| Interquartile 25% (IQ1) | 21.2% | 15.1% |
| Interquartile 75% (IQ3) | 36.1% | 32.4% |
| Interquartile Range (IQR) | 14.9% | 17.3% |
| Standard Deviation (Sample) | 15.3% | 12.8% |
| Standard Deviation (Population) | 15.1% | 12.7% |
Similar Demographics by 3 or more Vehicles in Household
Demographics Similar to New Zealanders by 3 or more Vehicles in Household
In terms of 3 or more vehicles in household, the demographic groups most similar to New Zealanders are Immigrants from Bolivia (20.4%, a difference of 0.17%), Slavic (20.4%, a difference of 0.20%), Immigrants from Netherlands (20.4%, a difference of 0.41%), Central American (20.5%, a difference of 0.45%), and Zimbabwean (20.3%, a difference of 0.52%).
| Demographics | Rating | Rank | 3 or more Vehicles in Household |
| Immigrants | Thailand | 93.8 /100 | #121 | Exceptional 20.5% |
| German Russians | 93.7 /100 | #122 | Exceptional 20.5% |
| Immigrants | Korea | 93.7 /100 | #123 | Exceptional 20.5% |
| Central Americans | 93.1 /100 | #124 | Exceptional 20.5% |
| Immigrants | Netherlands | 92.9 /100 | #125 | Exceptional 20.4% |
| Slavs | 92.1 /100 | #126 | Exceptional 20.4% |
| Immigrants | Bolivia | 92.0 /100 | #127 | Exceptional 20.4% |
| New Zealanders | 91.3 /100 | #128 | Exceptional 20.4% |
| Zimbabweans | 88.7 /100 | #129 | Excellent 20.3% |
| Greeks | 88.6 /100 | #130 | Excellent 20.3% |
| Immigrants | Asia | 88.1 /100 | #131 | Excellent 20.2% |
| Immigrants | Canada | 87.8 /100 | #132 | Excellent 20.2% |
| Immigrants | North America | 87.8 /100 | #133 | Excellent 20.2% |
| Poles | 87.3 /100 | #134 | Excellent 20.2% |
| Immigrants | India | 87.2 /100 | #135 | Excellent 20.2% |
Demographics Similar to Apache by 3 or more Vehicles in Household
In terms of 3 or more vehicles in household, the demographic groups most similar to Apache are Belgian (21.2%, a difference of 0.080%), Immigrants from Indonesia (21.1%, a difference of 0.20%), Immigrants from Afghanistan (21.2%, a difference of 0.41%), Immigrants from Cambodia (21.1%, a difference of 0.43%), and Pakistani (21.0%, a difference of 0.57%).
| Demographics | Rating | Rank | 3 or more Vehicles in Household |
| Laotians | 99.6 /100 | #85 | Exceptional 21.5% |
| Delaware | 99.6 /100 | #86 | Exceptional 21.5% |
| Immigrants | Azores | 99.5 /100 | #87 | Exceptional 21.5% |
| French | 99.4 /100 | #88 | Exceptional 21.4% |
| Marshallese | 99.2 /100 | #89 | Exceptional 21.3% |
| Immigrants | Afghanistan | 99.1 /100 | #90 | Exceptional 21.2% |
| Belgians | 98.9 /100 | #91 | Exceptional 21.2% |
| Apache | 98.9 /100 | #92 | Exceptional 21.2% |
| Immigrants | Indonesia | 98.8 /100 | #93 | Exceptional 21.1% |
| Immigrants | Cambodia | 98.6 /100 | #94 | Exceptional 21.1% |
| Pakistanis | 98.5 /100 | #95 | Exceptional 21.0% |
| Cree | 98.4 /100 | #96 | Exceptional 21.0% |
| Canadians | 98.3 /100 | #97 | Exceptional 21.0% |
| Hmong | 98.2 /100 | #98 | Exceptional 21.0% |
| Alaska Natives | 98.2 /100 | #99 | Exceptional 21.0% |