New Zealander vs Immigrants from Turkey 3 or more Vehicles in Household
COMPARE
New Zealander
Immigrants from Turkey
3 or more Vehicles in Household
3 or more Vehicles in Household Comparison
New Zealanders
Immigrants from Turkey
20.4%
3 OR MORE VEHICLES IN HOUSEHOLD
91.3/ 100
METRIC RATING
128th/ 347
METRIC RANK
17.9%
3 OR MORE VEHICLES IN HOUSEHOLD
1.2/ 100
METRIC RATING
255th/ 347
METRIC RANK
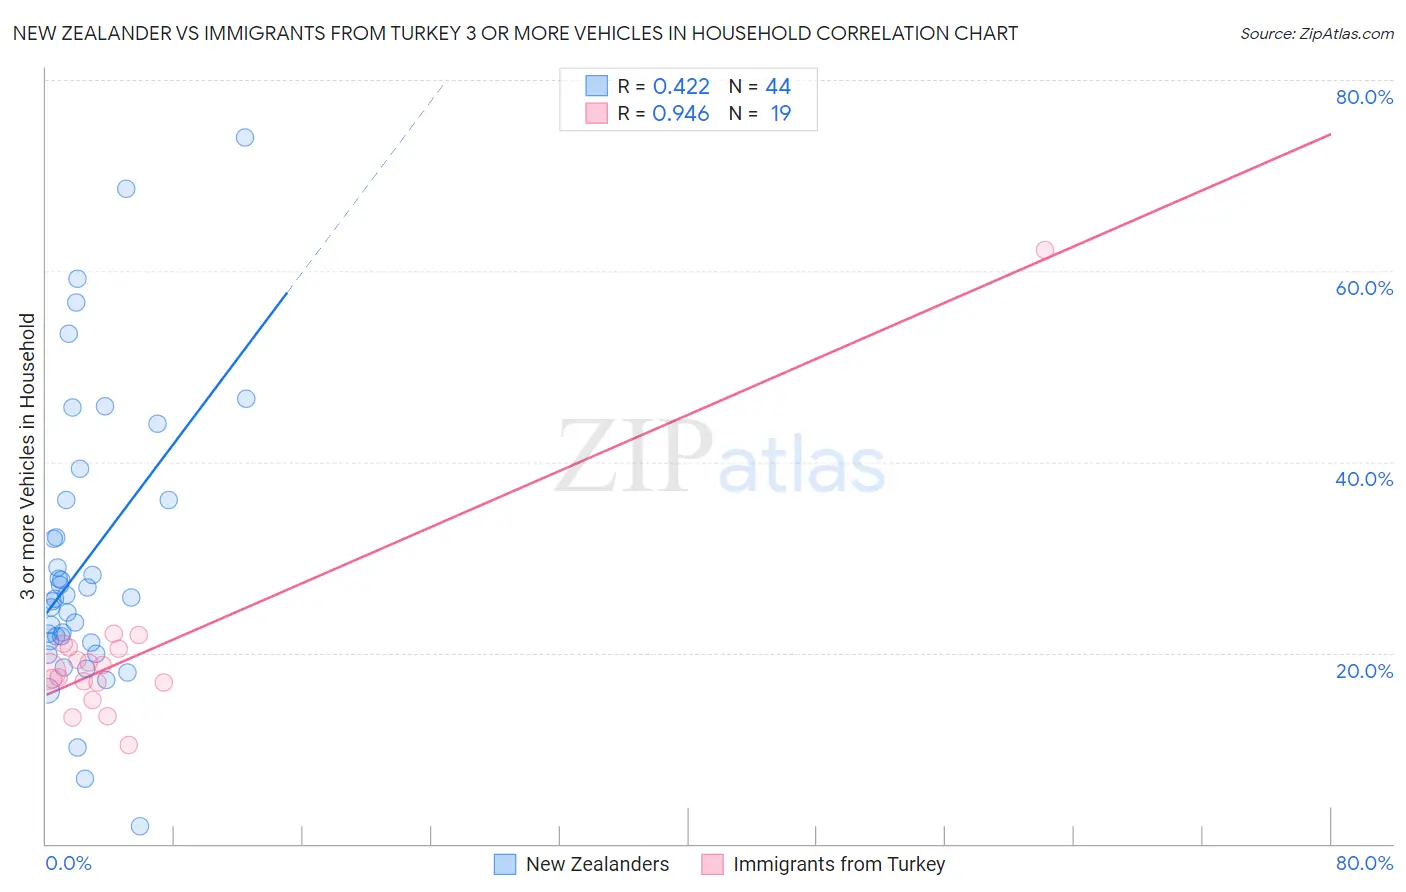
New Zealander vs Immigrants from Turkey 3 or more Vehicles in Household Correlation Chart
The statistical analysis conducted on geographies consisting of 106,882,673 people shows a moderate positive correlation between the proportion of New Zealanders and percentage of households with 3 or more vehicles available in the United States with a correlation coefficient (R) of 0.422 and weighted average of 20.4%. Similarly, the statistical analysis conducted on geographies consisting of 222,920,746 people shows a near-perfect positive correlation between the proportion of Immigrants from Turkey and percentage of households with 3 or more vehicles available in the United States with a correlation coefficient (R) of 0.946 and weighted average of 17.9%, a difference of 13.9%.
3 or more Vehicles in Household Correlation Summary
| Measurement | New Zealander | Immigrants from Turkey |
| Minimum | 1.8% | 10.4% |
| Maximum | 74.0% | 62.2% |
| Range | 72.2% | 51.8% |
| Mean | 29.8% | 20.0% |
| Median | 25.7% | 18.0% |
| Interquartile 25% (IQ1) | 21.2% | 16.8% |
| Interquartile 75% (IQ3) | 36.1% | 20.6% |
| Interquartile Range (IQR) | 14.9% | 3.7% |
| Standard Deviation (Sample) | 15.3% | 10.7% |
| Standard Deviation (Population) | 15.1% | 10.4% |
Similar Demographics by 3 or more Vehicles in Household
Demographics Similar to New Zealanders by 3 or more Vehicles in Household
In terms of 3 or more vehicles in household, the demographic groups most similar to New Zealanders are Immigrants from Bolivia (20.4%, a difference of 0.17%), Slavic (20.4%, a difference of 0.20%), Immigrants from Netherlands (20.4%, a difference of 0.41%), Central American (20.5%, a difference of 0.45%), and Zimbabwean (20.3%, a difference of 0.52%).
| Demographics | Rating | Rank | 3 or more Vehicles in Household |
| Immigrants | Thailand | 93.8 /100 | #121 | Exceptional 20.5% |
| German Russians | 93.7 /100 | #122 | Exceptional 20.5% |
| Immigrants | Korea | 93.7 /100 | #123 | Exceptional 20.5% |
| Central Americans | 93.1 /100 | #124 | Exceptional 20.5% |
| Immigrants | Netherlands | 92.9 /100 | #125 | Exceptional 20.4% |
| Slavs | 92.1 /100 | #126 | Exceptional 20.4% |
| Immigrants | Bolivia | 92.0 /100 | #127 | Exceptional 20.4% |
| New Zealanders | 91.3 /100 | #128 | Exceptional 20.4% |
| Zimbabweans | 88.7 /100 | #129 | Excellent 20.3% |
| Greeks | 88.6 /100 | #130 | Excellent 20.3% |
| Immigrants | Asia | 88.1 /100 | #131 | Excellent 20.2% |
| Immigrants | Canada | 87.8 /100 | #132 | Excellent 20.2% |
| Immigrants | North America | 87.8 /100 | #133 | Excellent 20.2% |
| Poles | 87.3 /100 | #134 | Excellent 20.2% |
| Immigrants | India | 87.2 /100 | #135 | Excellent 20.2% |
Demographics Similar to Immigrants from Turkey by 3 or more Vehicles in Household
In terms of 3 or more vehicles in household, the demographic groups most similar to Immigrants from Turkey are Immigrants from Ethiopia (17.9%, a difference of 0.030%), Ethiopian (17.9%, a difference of 0.030%), Subsaharan African (17.9%, a difference of 0.15%), Immigrants from Eritrea (17.8%, a difference of 0.20%), and Sudanese (17.8%, a difference of 0.20%).
| Demographics | Rating | Rank | 3 or more Vehicles in Household |
| Immigrants | Eastern Africa | 1.8 /100 | #248 | Tragic 18.0% |
| Immigrants | Saudi Arabia | 1.7 /100 | #249 | Tragic 18.0% |
| Venezuelans | 1.7 /100 | #250 | Tragic 18.0% |
| Alsatians | 1.5 /100 | #251 | Tragic 18.0% |
| Immigrants | Southern Europe | 1.4 /100 | #252 | Tragic 17.9% |
| Immigrants | Ethiopia | 1.3 /100 | #253 | Tragic 17.9% |
| Ethiopians | 1.2 /100 | #254 | Tragic 17.9% |
| Immigrants | Turkey | 1.2 /100 | #255 | Tragic 17.9% |
| Sub-Saharan Africans | 1.1 /100 | #256 | Tragic 17.9% |
| Immigrants | Eritrea | 1.1 /100 | #257 | Tragic 17.8% |
| Sudanese | 1.1 /100 | #258 | Tragic 17.8% |
| Uruguayans | 1.0 /100 | #259 | Tragic 17.8% |
| Ugandans | 0.9 /100 | #260 | Tragic 17.8% |
| Immigrants | Northern Africa | 0.9 /100 | #261 | Tragic 17.8% |
| Colombians | 0.9 /100 | #262 | Tragic 17.8% |