New Zealander vs Tohono O'odham Hearing Disability
COMPARE
New Zealander
Tohono O'odham
Hearing Disability
Hearing Disability Comparison
New Zealanders
Tohono O'odham
3.2%
HEARING DISABILITY
6.8/ 100
METRIC RATING
219th/ 347
METRIC RANK
4.2%
HEARING DISABILITY
0.0/ 100
METRIC RATING
328th/ 347
METRIC RANK
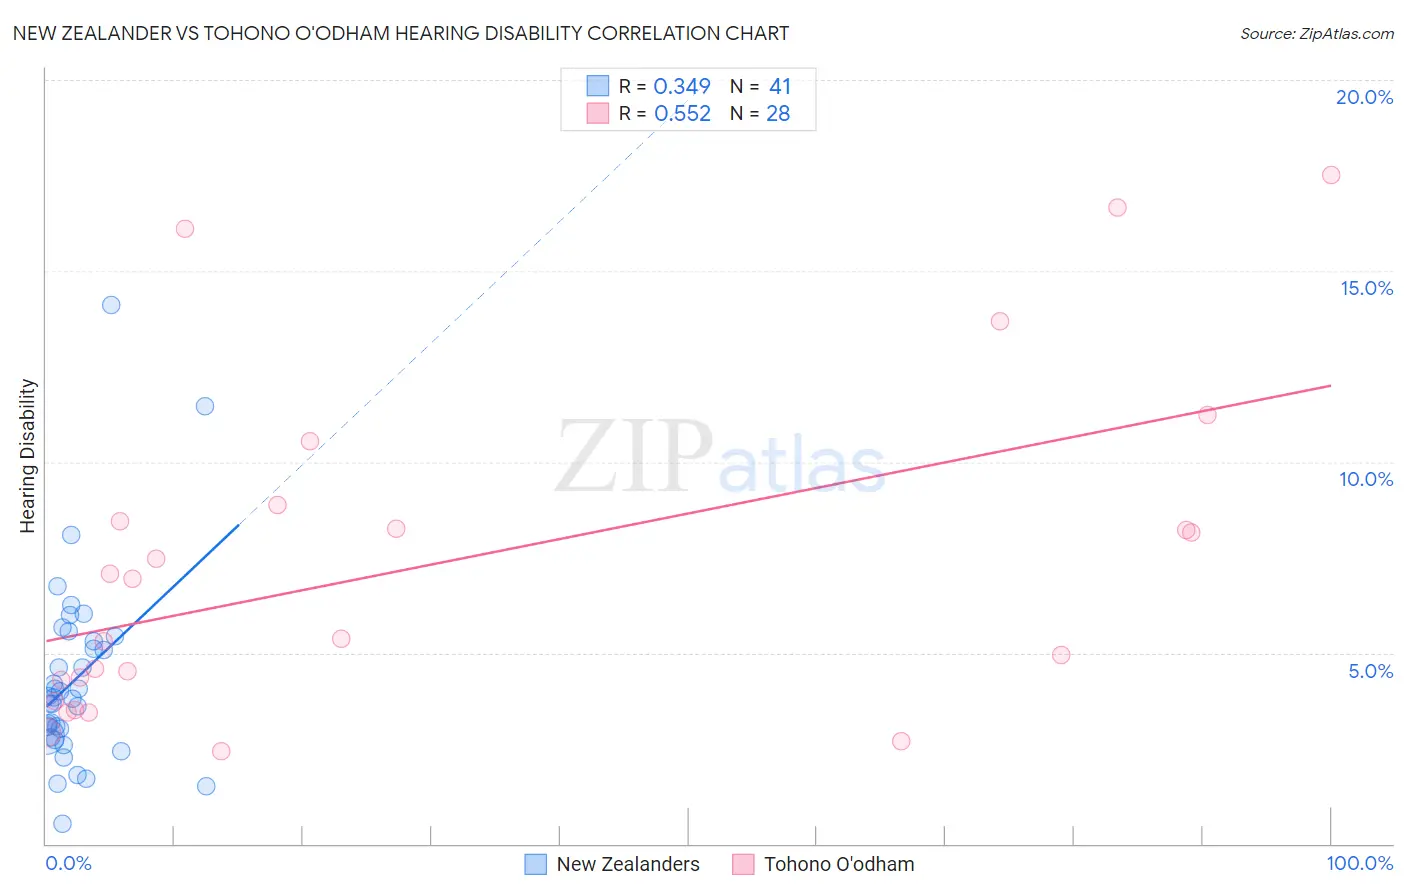
New Zealander vs Tohono O'odham Hearing Disability Correlation Chart
The statistical analysis conducted on geographies consisting of 106,920,080 people shows a mild positive correlation between the proportion of New Zealanders and percentage of population with hearing disability in the United States with a correlation coefficient (R) of 0.349 and weighted average of 3.2%. Similarly, the statistical analysis conducted on geographies consisting of 58,715,422 people shows a substantial positive correlation between the proportion of Tohono O'odham and percentage of population with hearing disability in the United States with a correlation coefficient (R) of 0.552 and weighted average of 4.2%, a difference of 31.0%.
Hearing Disability Correlation Summary
| Measurement | New Zealander | Tohono O'odham |
| Minimum | 0.53% | 2.4% |
| Maximum | 14.1% | 17.5% |
| Range | 13.6% | 15.1% |
| Mean | 4.3% | 7.3% |
| Median | 3.8% | 6.1% |
| Interquartile 25% (IQ1) | 2.8% | 4.0% |
| Interquartile 75% (IQ3) | 5.4% | 8.7% |
| Interquartile Range (IQR) | 2.6% | 4.7% |
| Standard Deviation (Sample) | 2.5% | 4.3% |
| Standard Deviation (Population) | 2.5% | 4.3% |
Similar Demographics by Hearing Disability
Demographics Similar to New Zealanders by Hearing Disability
In terms of hearing disability, the demographic groups most similar to New Zealanders are Immigrants from Northern Europe (3.2%, a difference of 0.060%), Malaysian (3.2%, a difference of 0.060%), Immigrants from Laos (3.2%, a difference of 0.060%), Russian (3.2%, a difference of 0.10%), and Immigrants from Oceania (3.2%, a difference of 0.10%).
| Demographics | Rating | Rank | Hearing Disability |
| Pakistanis | 11.1 /100 | #212 | Poor 3.1% |
| Immigrants | Iraq | 10.5 /100 | #213 | Poor 3.1% |
| Australians | 8.1 /100 | #214 | Tragic 3.2% |
| Bangladeshis | 8.1 /100 | #215 | Tragic 3.2% |
| Immigrants | Norway | 7.3 /100 | #216 | Tragic 3.2% |
| Russians | 7.1 /100 | #217 | Tragic 3.2% |
| Immigrants | Northern Europe | 7.0 /100 | #218 | Tragic 3.2% |
| New Zealanders | 6.8 /100 | #219 | Tragic 3.2% |
| Malaysians | 6.6 /100 | #220 | Tragic 3.2% |
| Immigrants | Laos | 6.6 /100 | #221 | Tragic 3.2% |
| Immigrants | Oceania | 6.5 /100 | #222 | Tragic 3.2% |
| Mexicans | 5.6 /100 | #223 | Tragic 3.2% |
| Icelanders | 5.2 /100 | #224 | Tragic 3.2% |
| Latvians | 5.1 /100 | #225 | Tragic 3.2% |
| Lebanese | 5.0 /100 | #226 | Tragic 3.2% |
Demographics Similar to Tohono O'odham by Hearing Disability
In terms of hearing disability, the demographic groups most similar to Tohono O'odham are Crow (4.2%, a difference of 0.010%), Arapaho (4.1%, a difference of 0.38%), Native/Alaskan (4.2%, a difference of 0.80%), Cherokee (4.2%, a difference of 0.95%), and Potawatomi (4.1%, a difference of 1.1%).
| Demographics | Rating | Rank | Hearing Disability |
| Paiute | 0.0 /100 | #321 | Tragic 4.1% |
| Seminole | 0.0 /100 | #322 | Tragic 4.1% |
| Apache | 0.0 /100 | #323 | Tragic 4.1% |
| Osage | 0.0 /100 | #324 | Tragic 4.1% |
| Lumbee | 0.0 /100 | #325 | Tragic 4.1% |
| Potawatomi | 0.0 /100 | #326 | Tragic 4.1% |
| Arapaho | 0.0 /100 | #327 | Tragic 4.1% |
| Tohono O'odham | 0.0 /100 | #328 | Tragic 4.2% |
| Crow | 0.0 /100 | #329 | Tragic 4.2% |
| Natives/Alaskans | 0.0 /100 | #330 | Tragic 4.2% |
| Cherokee | 0.0 /100 | #331 | Tragic 4.2% |
| Houma | 0.0 /100 | #332 | Tragic 4.2% |
| Dutch West Indians | 0.0 /100 | #333 | Tragic 4.3% |
| Aleuts | 0.0 /100 | #334 | Tragic 4.3% |
| Kiowa | 0.0 /100 | #335 | Tragic 4.3% |