New Zealander vs Immigrants from Sierra Leone 3 or more Vehicles in Household
COMPARE
New Zealander
Immigrants from Sierra Leone
3 or more Vehicles in Household
3 or more Vehicles in Household Comparison
New Zealanders
Immigrants from Sierra Leone
20.4%
3 OR MORE VEHICLES IN HOUSEHOLD
91.3/ 100
METRIC RATING
128th/ 347
METRIC RANK
18.7%
3 OR MORE VEHICLES IN HOUSEHOLD
10.8/ 100
METRIC RATING
214th/ 347
METRIC RANK
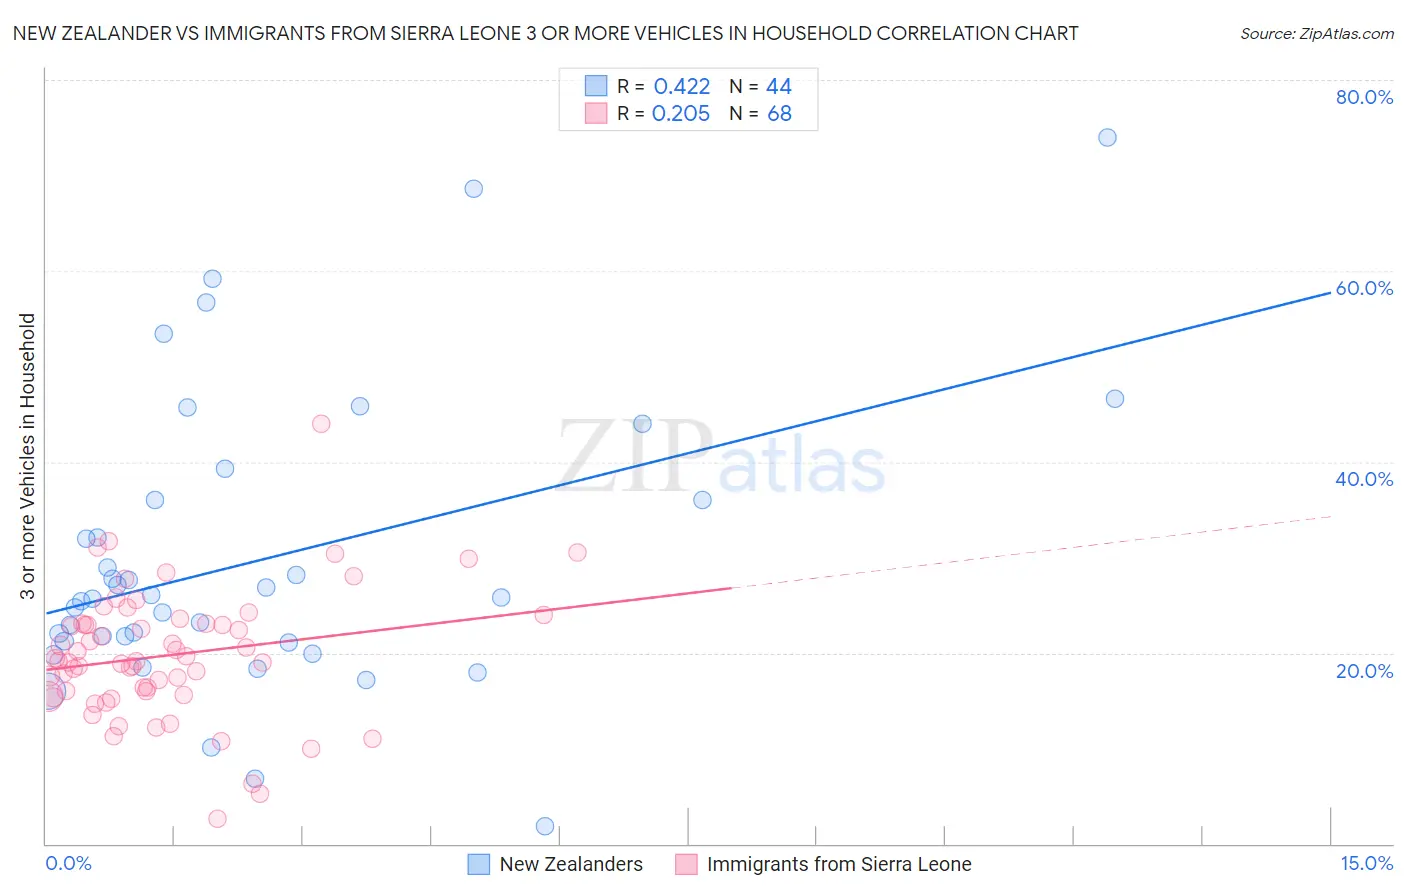
New Zealander vs Immigrants from Sierra Leone 3 or more Vehicles in Household Correlation Chart
The statistical analysis conducted on geographies consisting of 106,882,673 people shows a moderate positive correlation between the proportion of New Zealanders and percentage of households with 3 or more vehicles available in the United States with a correlation coefficient (R) of 0.422 and weighted average of 20.4%. Similarly, the statistical analysis conducted on geographies consisting of 101,640,552 people shows a weak positive correlation between the proportion of Immigrants from Sierra Leone and percentage of households with 3 or more vehicles available in the United States with a correlation coefficient (R) of 0.205 and weighted average of 18.7%, a difference of 8.8%.
3 or more Vehicles in Household Correlation Summary
| Measurement | New Zealander | Immigrants from Sierra Leone |
| Minimum | 1.8% | 2.6% |
| Maximum | 74.0% | 44.1% |
| Range | 72.2% | 41.5% |
| Mean | 29.8% | 19.7% |
| Median | 25.7% | 19.1% |
| Interquartile 25% (IQ1) | 21.2% | 15.8% |
| Interquartile 75% (IQ3) | 36.1% | 23.1% |
| Interquartile Range (IQR) | 14.9% | 7.3% |
| Standard Deviation (Sample) | 15.3% | 6.8% |
| Standard Deviation (Population) | 15.1% | 6.7% |
Similar Demographics by 3 or more Vehicles in Household
Demographics Similar to New Zealanders by 3 or more Vehicles in Household
In terms of 3 or more vehicles in household, the demographic groups most similar to New Zealanders are Immigrants from Bolivia (20.4%, a difference of 0.17%), Slavic (20.4%, a difference of 0.20%), Immigrants from Netherlands (20.4%, a difference of 0.41%), Central American (20.5%, a difference of 0.45%), and Zimbabwean (20.3%, a difference of 0.52%).
| Demographics | Rating | Rank | 3 or more Vehicles in Household |
| Immigrants | Thailand | 93.8 /100 | #121 | Exceptional 20.5% |
| German Russians | 93.7 /100 | #122 | Exceptional 20.5% |
| Immigrants | Korea | 93.7 /100 | #123 | Exceptional 20.5% |
| Central Americans | 93.1 /100 | #124 | Exceptional 20.5% |
| Immigrants | Netherlands | 92.9 /100 | #125 | Exceptional 20.4% |
| Slavs | 92.1 /100 | #126 | Exceptional 20.4% |
| Immigrants | Bolivia | 92.0 /100 | #127 | Exceptional 20.4% |
| New Zealanders | 91.3 /100 | #128 | Exceptional 20.4% |
| Zimbabweans | 88.7 /100 | #129 | Excellent 20.3% |
| Greeks | 88.6 /100 | #130 | Excellent 20.3% |
| Immigrants | Asia | 88.1 /100 | #131 | Excellent 20.2% |
| Immigrants | Canada | 87.8 /100 | #132 | Excellent 20.2% |
| Immigrants | North America | 87.8 /100 | #133 | Excellent 20.2% |
| Poles | 87.3 /100 | #134 | Excellent 20.2% |
| Immigrants | India | 87.2 /100 | #135 | Excellent 20.2% |
Demographics Similar to Immigrants from Sierra Leone by 3 or more Vehicles in Household
In terms of 3 or more vehicles in household, the demographic groups most similar to Immigrants from Sierra Leone are Eastern European (18.7%, a difference of 0.050%), Immigrants from Nigeria (18.7%, a difference of 0.10%), Immigrants from Italy (18.7%, a difference of 0.13%), Immigrants from Cuba (18.8%, a difference of 0.15%), and Panamanian (18.8%, a difference of 0.16%).
| Demographics | Rating | Rank | 3 or more Vehicles in Household |
| Immigrants | Chile | 13.6 /100 | #207 | Poor 18.8% |
| Immigrants | Burma/Myanmar | 13.6 /100 | #208 | Poor 18.8% |
| Immigrants | Egypt | 13.5 /100 | #209 | Poor 18.8% |
| Bulgarians | 13.1 /100 | #210 | Poor 18.8% |
| Immigrants | Kenya | 12.4 /100 | #211 | Poor 18.8% |
| Panamanians | 11.6 /100 | #212 | Poor 18.8% |
| Immigrants | Cuba | 11.6 /100 | #213 | Poor 18.8% |
| Immigrants | Sierra Leone | 10.8 /100 | #214 | Poor 18.7% |
| Eastern Europeans | 10.6 /100 | #215 | Poor 18.7% |
| Immigrants | Nigeria | 10.3 /100 | #216 | Poor 18.7% |
| Immigrants | Italy | 10.2 /100 | #217 | Poor 18.7% |
| Immigrants | Portugal | 8.9 /100 | #218 | Tragic 18.6% |
| Immigrants | Armenia | 8.6 /100 | #219 | Tragic 18.6% |
| Nigerians | 7.9 /100 | #220 | Tragic 18.6% |
| Immigrants | Poland | 7.5 /100 | #221 | Tragic 18.6% |