Puget Sound Salish vs Tohono O'odham 3 or more Vehicles in Household
COMPARE
Puget Sound Salish
Tohono O'odham
3 or more Vehicles in Household
3 or more Vehicles in Household Comparison
Puget Sound Salish
Tohono O'odham
26.4%
3 OR MORE VEHICLES IN HOUSEHOLD
100.0/ 100
METRIC RATING
5th/ 347
METRIC RANK
18.9%
3 OR MORE VEHICLES IN HOUSEHOLD
14.8/ 100
METRIC RATING
203rd/ 347
METRIC RANK
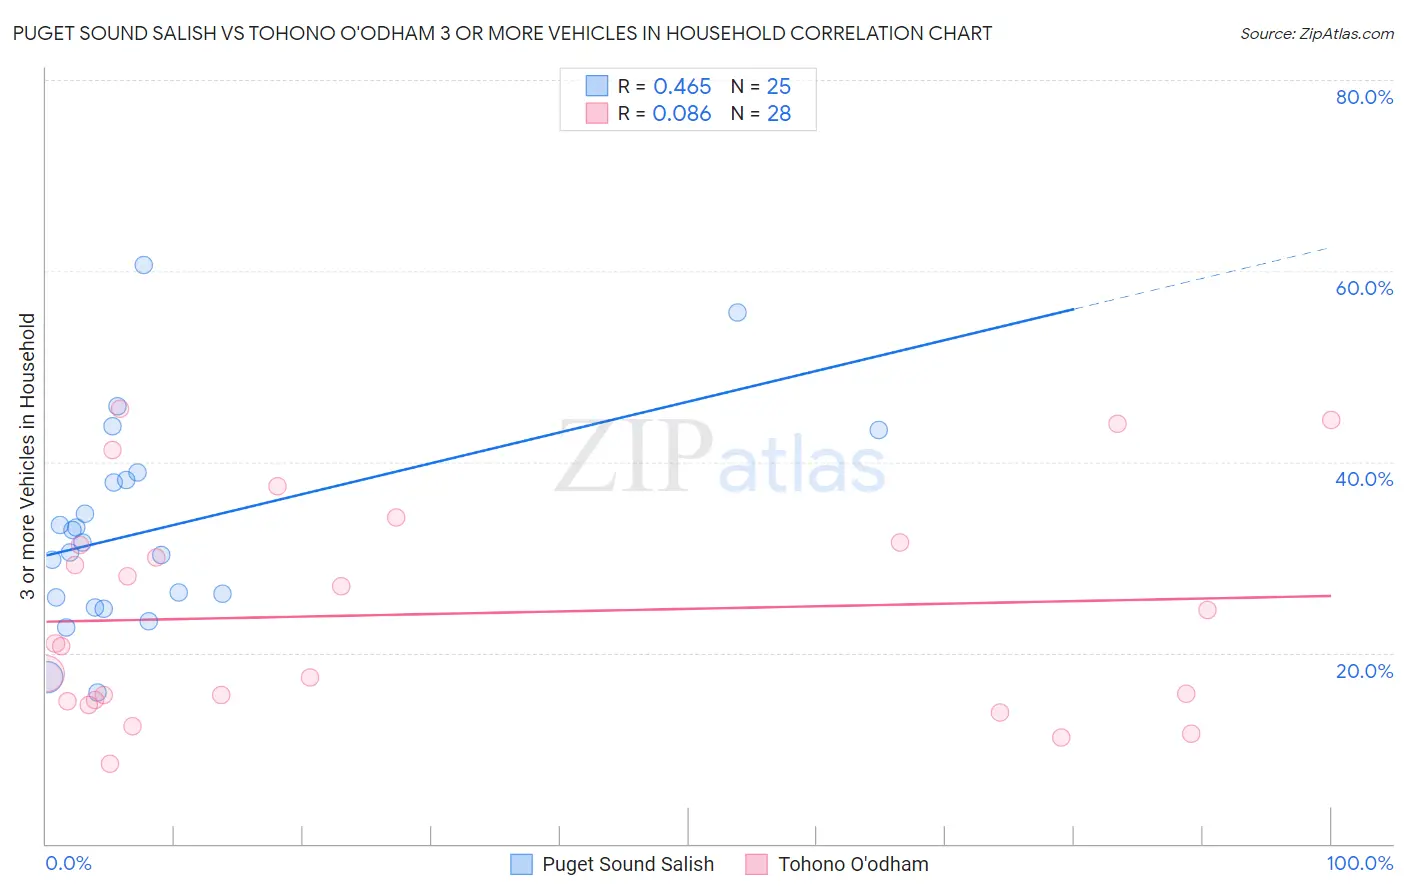
Puget Sound Salish vs Tohono O'odham 3 or more Vehicles in Household Correlation Chart
The statistical analysis conducted on geographies consisting of 46,155,628 people shows a moderate positive correlation between the proportion of Puget Sound Salish and percentage of households with 3 or more vehicles available in the United States with a correlation coefficient (R) of 0.465 and weighted average of 26.4%. Similarly, the statistical analysis conducted on geographies consisting of 58,717,373 people shows a slight positive correlation between the proportion of Tohono O'odham and percentage of households with 3 or more vehicles available in the United States with a correlation coefficient (R) of 0.086 and weighted average of 18.9%, a difference of 39.8%.
3 or more Vehicles in Household Correlation Summary
| Measurement | Puget Sound Salish | Tohono O'odham |
| Minimum | 15.8% | 8.4% |
| Maximum | 60.7% | 45.6% |
| Range | 44.8% | 37.1% |
| Mean | 33.1% | 24.1% |
| Median | 31.6% | 20.8% |
| Interquartile 25% (IQ1) | 25.3% | 15.0% |
| Interquartile 75% (IQ3) | 38.5% | 31.4% |
| Interquartile Range (IQR) | 13.2% | 16.4% |
| Standard Deviation (Sample) | 10.8% | 11.3% |
| Standard Deviation (Population) | 10.6% | 11.1% |
Similar Demographics by 3 or more Vehicles in Household
Demographics Similar to Puget Sound Salish by 3 or more Vehicles in Household
In terms of 3 or more vehicles in household, the demographic groups most similar to Puget Sound Salish are Arapaho (26.4%, a difference of 0.34%), Tongan (26.5%, a difference of 0.67%), Immigrants from Fiji (26.1%, a difference of 1.2%), Spanish American Indian (26.9%, a difference of 2.2%), and Colville (25.8%, a difference of 2.3%).
| Demographics | Rating | Rank | 3 or more Vehicles in Household |
| Yakama | 100.0 /100 | #1 | Exceptional 31.0% |
| Spanish American Indians | 100.0 /100 | #2 | Exceptional 26.9% |
| Tongans | 100.0 /100 | #3 | Exceptional 26.5% |
| Arapaho | 100.0 /100 | #4 | Exceptional 26.4% |
| Puget Sound Salish | 100.0 /100 | #5 | Exceptional 26.4% |
| Immigrants | Fiji | 100.0 /100 | #6 | Exceptional 26.1% |
| Colville | 100.0 /100 | #7 | Exceptional 25.8% |
| Samoans | 100.0 /100 | #8 | Exceptional 25.0% |
| Native Hawaiians | 100.0 /100 | #9 | Exceptional 24.9% |
| Nepalese | 100.0 /100 | #10 | Exceptional 24.9% |
| Shoshone | 100.0 /100 | #11 | Exceptional 24.9% |
| Danes | 100.0 /100 | #12 | Exceptional 24.7% |
| Mexicans | 100.0 /100 | #13 | Exceptional 24.7% |
| Immigrants | Mexico | 100.0 /100 | #14 | Exceptional 24.6% |
| Hawaiians | 100.0 /100 | #15 | Exceptional 24.3% |
Demographics Similar to Tohono O'odham by 3 or more Vehicles in Household
In terms of 3 or more vehicles in household, the demographic groups most similar to Tohono O'odham are Immigrants from Romania (18.9%, a difference of 0.030%), Immigrants from Austria (18.9%, a difference of 0.090%), Russian (18.8%, a difference of 0.10%), Immigrants from Eastern Asia (18.8%, a difference of 0.11%), and Immigrants from Chile (18.8%, a difference of 0.19%).
| Demographics | Rating | Rank | 3 or more Vehicles in Household |
| Central American Indians | 22.2 /100 | #196 | Fair 19.0% |
| Immigrants | Japan | 22.0 /100 | #197 | Fair 19.0% |
| Egyptians | 19.5 /100 | #198 | Poor 19.0% |
| Immigrants | Norway | 19.0 /100 | #199 | Poor 19.0% |
| Argentineans | 18.2 /100 | #200 | Poor 18.9% |
| Arabs | 17.7 /100 | #201 | Poor 18.9% |
| Immigrants | Austria | 15.4 /100 | #202 | Poor 18.9% |
| Tohono O'odham | 14.8 /100 | #203 | Poor 18.9% |
| Immigrants | Romania | 14.6 /100 | #204 | Poor 18.9% |
| Russians | 14.2 /100 | #205 | Poor 18.8% |
| Immigrants | Eastern Asia | 14.1 /100 | #206 | Poor 18.8% |
| Immigrants | Chile | 13.6 /100 | #207 | Poor 18.8% |
| Immigrants | Burma/Myanmar | 13.6 /100 | #208 | Poor 18.8% |
| Immigrants | Egypt | 13.5 /100 | #209 | Poor 18.8% |
| Bulgarians | 13.1 /100 | #210 | Poor 18.8% |