French American Indian vs Cherokee 3 or more Vehicles in Household
COMPARE
French American Indian
Cherokee
3 or more Vehicles in Household
3 or more Vehicles in Household Comparison
French American Indians
Cherokee
20.1%
3 OR MORE VEHICLES IN HOUSEHOLD
85.3/ 100
METRIC RATING
140th/ 347
METRIC RANK
23.0%
3 OR MORE VEHICLES IN HOUSEHOLD
100.0/ 100
METRIC RATING
36th/ 347
METRIC RANK
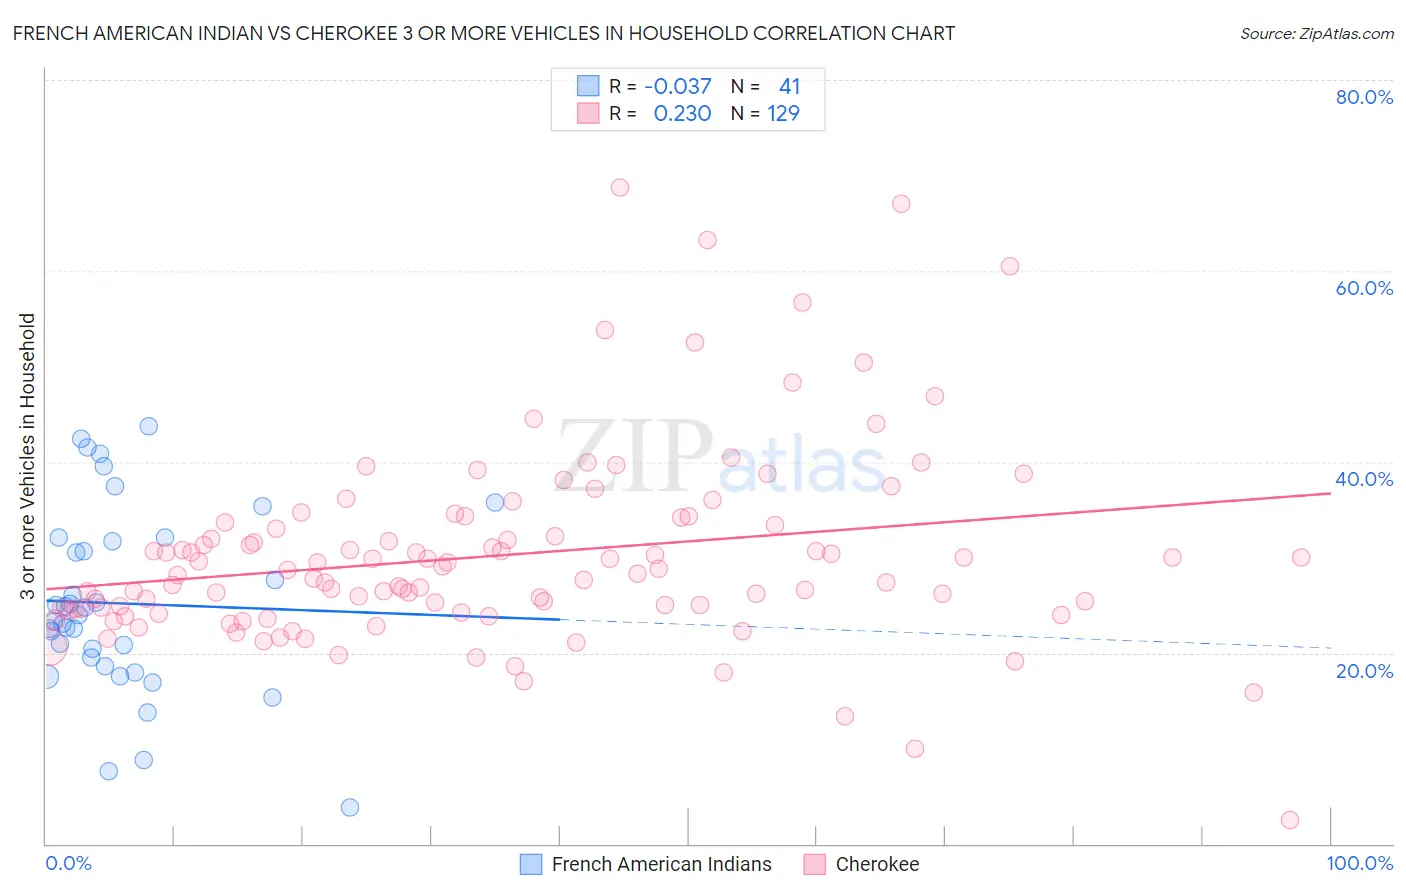
French American Indian vs Cherokee 3 or more Vehicles in Household Correlation Chart
The statistical analysis conducted on geographies consisting of 131,968,007 people shows no correlation between the proportion of French American Indians and percentage of households with 3 or more vehicles available in the United States with a correlation coefficient (R) of -0.037 and weighted average of 20.1%. Similarly, the statistical analysis conducted on geographies consisting of 493,301,702 people shows a weak positive correlation between the proportion of Cherokee and percentage of households with 3 or more vehicles available in the United States with a correlation coefficient (R) of 0.230 and weighted average of 23.0%, a difference of 14.1%.
3 or more Vehicles in Household Correlation Summary
| Measurement | French American Indian | Cherokee |
| Minimum | 3.7% | 2.4% |
| Maximum | 43.8% | 68.8% |
| Range | 40.0% | 66.3% |
| Mean | 25.2% | 30.2% |
| Median | 24.0% | 28.3% |
| Interquartile 25% (IQ1) | 19.0% | 24.5% |
| Interquartile 75% (IQ3) | 31.9% | 33.5% |
| Interquartile Range (IQR) | 12.8% | 9.0% |
| Standard Deviation (Sample) | 9.5% | 10.2% |
| Standard Deviation (Population) | 9.4% | 10.2% |
Similar Demographics by 3 or more Vehicles in Household
Demographics Similar to French American Indians by 3 or more Vehicles in Household
In terms of 3 or more vehicles in household, the demographic groups most similar to French American Indians are Slovene (20.2%, a difference of 0.030%), Ottawa (20.1%, a difference of 0.060%), Jordanian (20.1%, a difference of 0.12%), Lithuanian (20.1%, a difference of 0.13%), and Aleut (20.2%, a difference of 0.15%).
| Demographics | Rating | Rank | 3 or more Vehicles in Household |
| Immigrants | North America | 87.8 /100 | #133 | Excellent 20.2% |
| Poles | 87.3 /100 | #134 | Excellent 20.2% |
| Immigrants | India | 87.2 /100 | #135 | Excellent 20.2% |
| Immigrants | Nicaragua | 87.1 /100 | #136 | Excellent 20.2% |
| Immigrants | Iraq | 87.1 /100 | #137 | Excellent 20.2% |
| Aleuts | 86.3 /100 | #138 | Excellent 20.2% |
| Slovenes | 85.5 /100 | #139 | Excellent 20.2% |
| French American Indians | 85.3 /100 | #140 | Excellent 20.1% |
| Ottawa | 84.9 /100 | #141 | Excellent 20.1% |
| Jordanians | 84.4 /100 | #142 | Excellent 20.1% |
| Lithuanians | 84.4 /100 | #143 | Excellent 20.1% |
| Iranians | 84.0 /100 | #144 | Excellent 20.1% |
| Palestinians | 83.9 /100 | #145 | Excellent 20.1% |
| Australians | 83.6 /100 | #146 | Excellent 20.1% |
| Slovaks | 83.0 /100 | #147 | Excellent 20.1% |
Demographics Similar to Cherokee by 3 or more Vehicles in Household
In terms of 3 or more vehicles in household, the demographic groups most similar to Cherokee are Swedish (23.0%, a difference of 0.030%), Choctaw (23.0%, a difference of 0.040%), Swiss (23.0%, a difference of 0.060%), Spanish American (23.0%, a difference of 0.11%), and Pueblo (23.0%, a difference of 0.17%).
| Demographics | Rating | Rank | 3 or more Vehicles in Household |
| Spanish | 100.0 /100 | #29 | Exceptional 23.1% |
| Immigrants | South Eastern Asia | 100.0 /100 | #30 | Exceptional 23.1% |
| English | 100.0 /100 | #31 | Exceptional 23.1% |
| Pueblo | 100.0 /100 | #32 | Exceptional 23.0% |
| Spanish Americans | 100.0 /100 | #33 | Exceptional 23.0% |
| Swiss | 100.0 /100 | #34 | Exceptional 23.0% |
| Choctaw | 100.0 /100 | #35 | Exceptional 23.0% |
| Cherokee | 100.0 /100 | #36 | Exceptional 23.0% |
| Swedes | 100.0 /100 | #37 | Exceptional 23.0% |
| Dutch | 100.0 /100 | #38 | Exceptional 22.9% |
| Yaqui | 100.0 /100 | #39 | Exceptional 22.9% |
| Europeans | 100.0 /100 | #40 | Exceptional 22.9% |
| Germans | 100.0 /100 | #41 | Exceptional 22.7% |
| Natives/Alaskans | 100.0 /100 | #42 | Exceptional 22.7% |
| Osage | 100.0 /100 | #43 | Exceptional 22.7% |