Immigrants from Pakistan vs Cherokee Female Disability
COMPARE
Immigrants from Pakistan
Cherokee
Female Disability
Female Disability Comparison
Immigrants from Pakistan
Cherokee
10.9%
FEMALE DISABILITY
100.0/ 100
METRIC RATING
20th/ 347
METRIC RANK
14.9%
FEMALE DISABILITY
0.0/ 100
METRIC RATING
334th/ 347
METRIC RANK
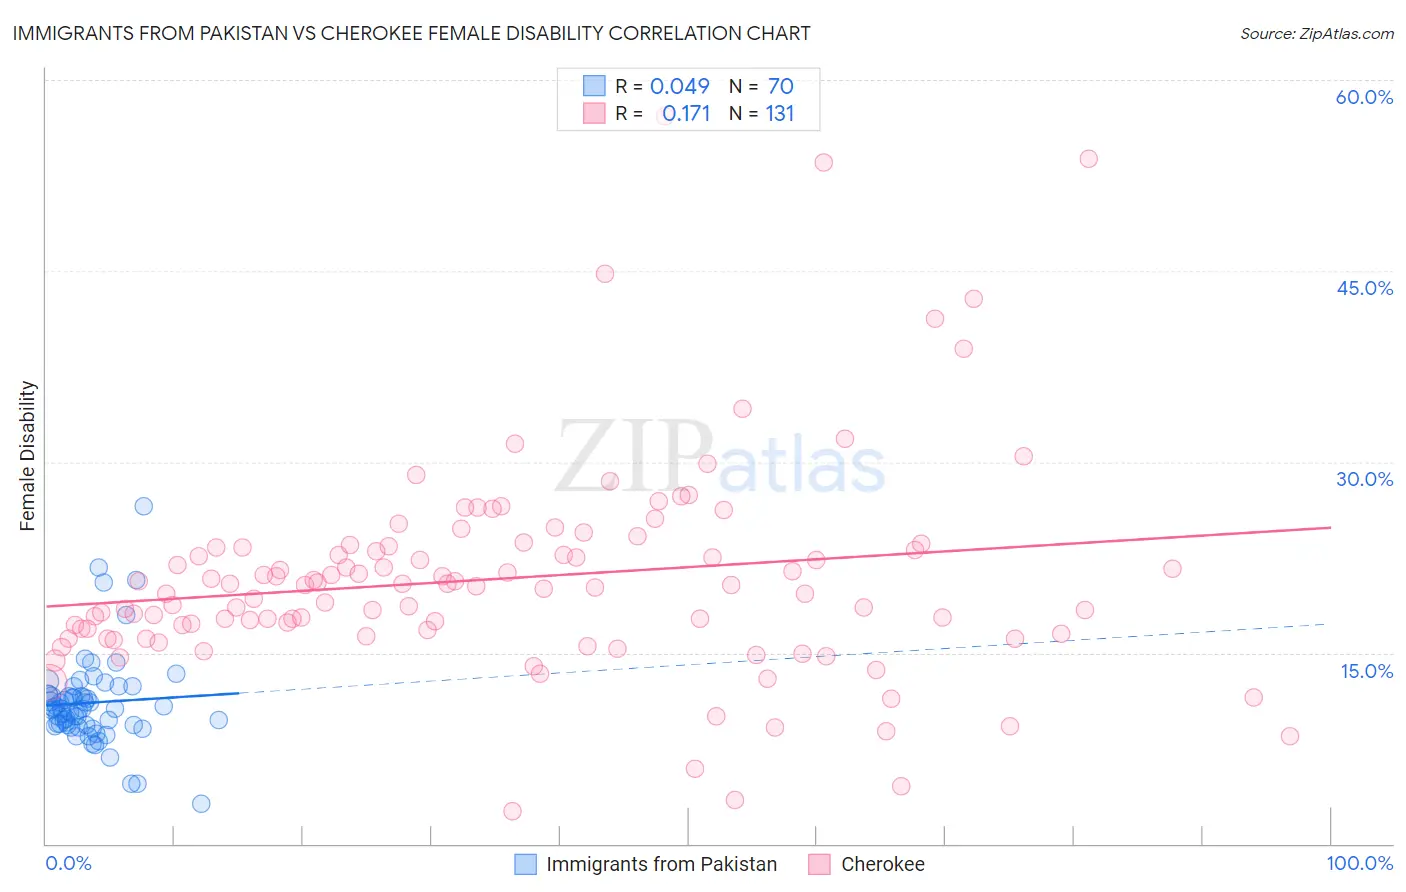
Immigrants from Pakistan vs Cherokee Female Disability Correlation Chart
The statistical analysis conducted on geographies consisting of 283,889,302 people shows no correlation between the proportion of Immigrants from Pakistan and percentage of females with a disability in the United States with a correlation coefficient (R) of 0.049 and weighted average of 10.9%. Similarly, the statistical analysis conducted on geographies consisting of 493,548,902 people shows a poor positive correlation between the proportion of Cherokee and percentage of females with a disability in the United States with a correlation coefficient (R) of 0.171 and weighted average of 14.9%, a difference of 36.7%.
Female Disability Correlation Summary
| Measurement | Immigrants from Pakistan | Cherokee |
| Minimum | 3.1% | 2.6% |
| Maximum | 26.5% | 57.1% |
| Range | 23.3% | 54.6% |
| Mean | 11.1% | 20.9% |
| Median | 10.6% | 20.2% |
| Interquartile 25% (IQ1) | 9.3% | 16.5% |
| Interquartile 75% (IQ3) | 11.7% | 23.3% |
| Interquartile Range (IQR) | 2.3% | 6.8% |
| Standard Deviation (Sample) | 3.6% | 8.5% |
| Standard Deviation (Population) | 3.6% | 8.5% |
Similar Demographics by Female Disability
Demographics Similar to Immigrants from Pakistan by Female Disability
In terms of female disability, the demographic groups most similar to Immigrants from Pakistan are Immigrants from Venezuela (10.9%, a difference of 0.17%), Asian (10.9%, a difference of 0.36%), Immigrants from Iran (10.8%, a difference of 0.39%), Immigrants from Sri Lanka (10.9%, a difference of 0.49%), and Venezuelan (11.0%, a difference of 0.71%).
| Demographics | Rating | Rank | Female Disability |
| Immigrants | Eastern Asia | 100.0 /100 | #13 | Exceptional 10.7% |
| Immigrants | China | 100.0 /100 | #14 | Exceptional 10.7% |
| Burmese | 100.0 /100 | #15 | Exceptional 10.7% |
| Okinawans | 100.0 /100 | #16 | Exceptional 10.8% |
| Indians (Asian) | 100.0 /100 | #17 | Exceptional 10.8% |
| Immigrants | Iran | 100.0 /100 | #18 | Exceptional 10.8% |
| Immigrants | Venezuela | 100.0 /100 | #19 | Exceptional 10.9% |
| Immigrants | Pakistan | 100.0 /100 | #20 | Exceptional 10.9% |
| Asians | 100.0 /100 | #21 | Exceptional 10.9% |
| Immigrants | Sri Lanka | 100.0 /100 | #22 | Exceptional 10.9% |
| Venezuelans | 100.0 /100 | #23 | Exceptional 11.0% |
| Immigrants | Argentina | 100.0 /100 | #24 | Exceptional 11.0% |
| Immigrants | Asia | 100.0 /100 | #25 | Exceptional 11.0% |
| Argentineans | 100.0 /100 | #26 | Exceptional 11.0% |
| Immigrants | Turkey | 100.0 /100 | #27 | Exceptional 11.1% |
Demographics Similar to Cherokee by Female Disability
In terms of female disability, the demographic groups most similar to Cherokee are Cajun (14.9%, a difference of 0.020%), Immigrants from the Azores (14.9%, a difference of 0.090%), Pima (14.8%, a difference of 0.48%), Seminole (15.0%, a difference of 0.69%), and Tohono O'odham (15.0%, a difference of 0.82%).
| Demographics | Rating | Rank | Female Disability |
| Ottawa | 0.0 /100 | #327 | Tragic 14.2% |
| Cape Verdeans | 0.0 /100 | #328 | Tragic 14.2% |
| Osage | 0.0 /100 | #329 | Tragic 14.3% |
| Yuman | 0.0 /100 | #330 | Tragic 14.5% |
| Immigrants | Cabo Verde | 0.0 /100 | #331 | Tragic 14.6% |
| Pima | 0.0 /100 | #332 | Tragic 14.8% |
| Immigrants | Azores | 0.0 /100 | #333 | Tragic 14.9% |
| Cherokee | 0.0 /100 | #334 | Tragic 14.9% |
| Cajuns | 0.0 /100 | #335 | Tragic 14.9% |
| Seminole | 0.0 /100 | #336 | Tragic 15.0% |
| Tohono O'odham | 0.0 /100 | #337 | Tragic 15.0% |
| Dutch West Indians | 0.0 /100 | #338 | Tragic 15.0% |
| Colville | 0.0 /100 | #339 | Tragic 15.1% |
| Chickasaw | 0.0 /100 | #340 | Tragic 15.2% |
| Choctaw | 0.0 /100 | #341 | Tragic 15.4% |