Immigrants from Norway vs Syrian 3 or more Vehicles in Household
COMPARE
Immigrants from Norway
Syrian
3 or more Vehicles in Household
3 or more Vehicles in Household Comparison
Immigrants from Norway
Syrians
19.0%
3 OR MORE VEHICLES IN HOUSEHOLD
19.0/ 100
METRIC RATING
199th/ 347
METRIC RANK
19.5%
3 OR MORE VEHICLES IN HOUSEHOLD
47.0/ 100
METRIC RATING
175th/ 347
METRIC RANK
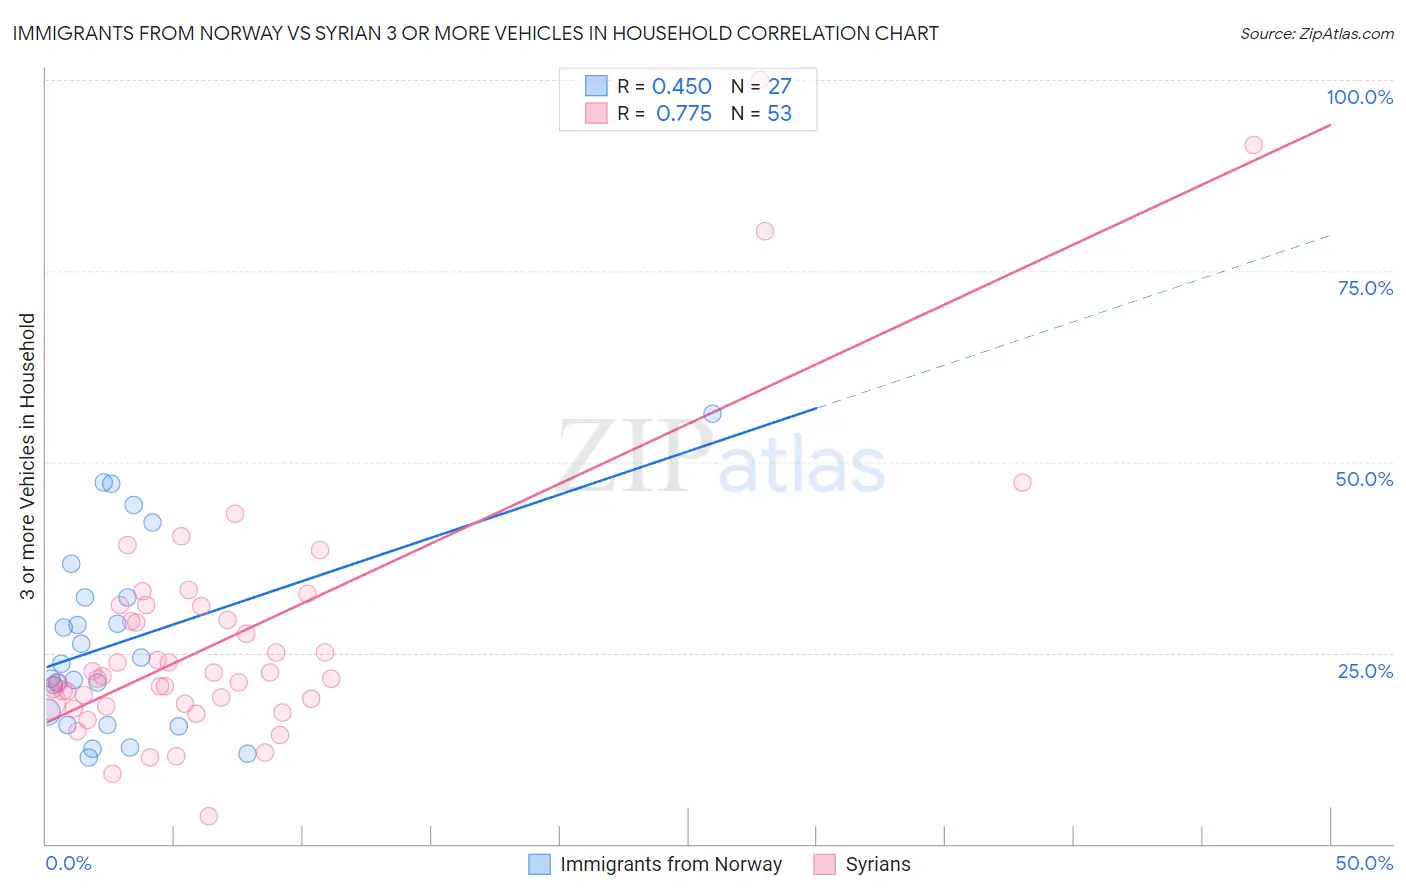
Immigrants from Norway vs Syrian 3 or more Vehicles in Household Correlation Chart
The statistical analysis conducted on geographies consisting of 116,675,464 people shows a moderate positive correlation between the proportion of Immigrants from Norway and percentage of households with 3 or more vehicles available in the United States with a correlation coefficient (R) of 0.450 and weighted average of 19.0%. Similarly, the statistical analysis conducted on geographies consisting of 266,128,737 people shows a strong positive correlation between the proportion of Syrians and percentage of households with 3 or more vehicles available in the United States with a correlation coefficient (R) of 0.775 and weighted average of 19.5%, a difference of 2.6%.
3 or more Vehicles in Household Correlation Summary
| Measurement | Immigrants from Norway | Syrian |
| Minimum | 11.3% | 3.6% |
| Maximum | 56.2% | 100.0% |
| Range | 45.0% | 96.4% |
| Mean | 26.5% | 27.2% |
| Median | 23.6% | 22.0% |
| Interquartile 25% (IQ1) | 15.5% | 18.5% |
| Interquartile 75% (IQ3) | 32.3% | 31.2% |
| Interquartile Range (IQR) | 16.8% | 12.6% |
| Standard Deviation (Sample) | 12.3% | 18.0% |
| Standard Deviation (Population) | 12.1% | 17.8% |
Similar Demographics by 3 or more Vehicles in Household
Demographics Similar to Immigrants from Norway by 3 or more Vehicles in Household
In terms of 3 or more vehicles in household, the demographic groups most similar to Immigrants from Norway are Egyptian (19.0%, a difference of 0.060%), Argentinean (18.9%, a difference of 0.10%), Arab (18.9%, a difference of 0.16%), Immigrants from Japan (19.0%, a difference of 0.36%), and Central American Indian (19.0%, a difference of 0.39%).
| Demographics | Rating | Rank | 3 or more Vehicles in Household |
| Kenyans | 24.7 /100 | #192 | Fair 19.1% |
| Tsimshian | 24.4 /100 | #193 | Fair 19.1% |
| Serbians | 24.0 /100 | #194 | Fair 19.1% |
| Immigrants | Moldova | 23.6 /100 | #195 | Fair 19.1% |
| Central American Indians | 22.2 /100 | #196 | Fair 19.0% |
| Immigrants | Japan | 22.0 /100 | #197 | Fair 19.0% |
| Egyptians | 19.5 /100 | #198 | Poor 19.0% |
| Immigrants | Norway | 19.0 /100 | #199 | Poor 19.0% |
| Argentineans | 18.2 /100 | #200 | Poor 18.9% |
| Arabs | 17.7 /100 | #201 | Poor 18.9% |
| Immigrants | Austria | 15.4 /100 | #202 | Poor 18.9% |
| Tohono O'odham | 14.8 /100 | #203 | Poor 18.9% |
| Immigrants | Romania | 14.6 /100 | #204 | Poor 18.9% |
| Russians | 14.2 /100 | #205 | Poor 18.8% |
| Immigrants | Eastern Asia | 14.1 /100 | #206 | Poor 18.8% |
Demographics Similar to Syrians by 3 or more Vehicles in Household
In terms of 3 or more vehicles in household, the demographic groups most similar to Syrians are Iroquois (19.4%, a difference of 0.070%), Immigrants from South Africa (19.5%, a difference of 0.23%), Immigrants from Northern Europe (19.5%, a difference of 0.25%), Kiowa (19.5%, a difference of 0.30%), and Immigrants from Peru (19.4%, a difference of 0.45%).
| Demographics | Rating | Rank | 3 or more Vehicles in Household |
| Peruvians | 58.8 /100 | #168 | Average 19.6% |
| Immigrants | Denmark | 57.6 /100 | #169 | Average 19.6% |
| Iraqis | 56.0 /100 | #170 | Average 19.6% |
| Immigrants | Western Europe | 53.2 /100 | #171 | Average 19.5% |
| Kiowa | 50.9 /100 | #172 | Average 19.5% |
| Immigrants | Northern Europe | 50.2 /100 | #173 | Average 19.5% |
| Immigrants | South Africa | 50.0 /100 | #174 | Average 19.5% |
| Syrians | 47.0 /100 | #175 | Average 19.5% |
| Iroquois | 46.0 /100 | #176 | Average 19.4% |
| Immigrants | Peru | 41.1 /100 | #177 | Average 19.4% |
| Immigrants | Syria | 40.3 /100 | #178 | Average 19.4% |
| Immigrants | South Central Asia | 38.9 /100 | #179 | Fair 19.3% |
| South Africans | 37.5 /100 | #180 | Fair 19.3% |
| Romanians | 37.1 /100 | #181 | Fair 19.3% |
| Cubans | 36.6 /100 | #182 | Fair 19.3% |