Immigrants from Turkey vs Syrian 3 or more Vehicles in Household
COMPARE
Immigrants from Turkey
Syrian
3 or more Vehicles in Household
3 or more Vehicles in Household Comparison
Immigrants from Turkey
Syrians
17.9%
3 OR MORE VEHICLES IN HOUSEHOLD
1.2/ 100
METRIC RATING
255th/ 347
METRIC RANK
19.5%
3 OR MORE VEHICLES IN HOUSEHOLD
47.0/ 100
METRIC RATING
175th/ 347
METRIC RANK
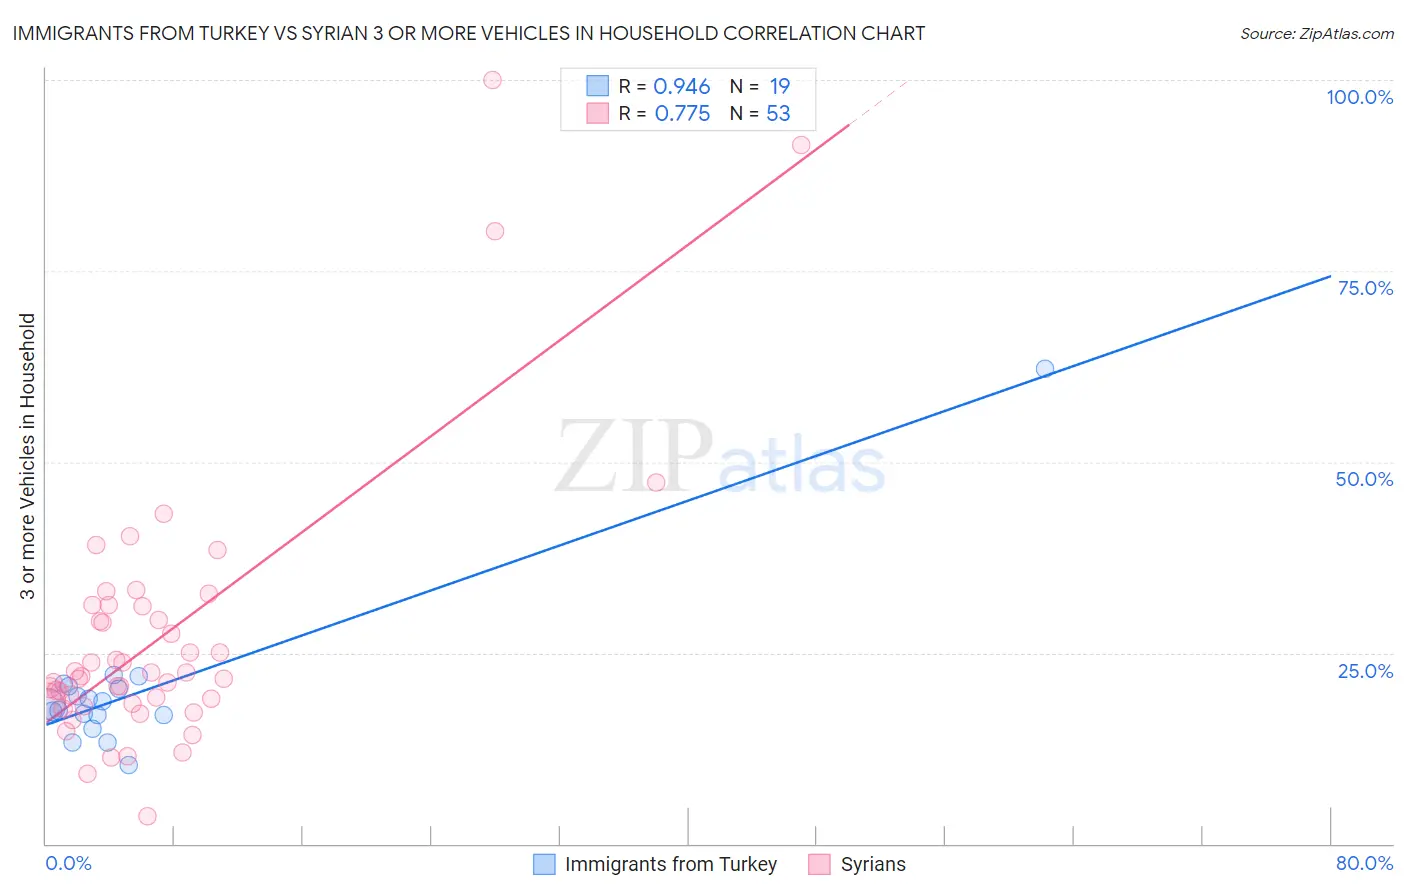
Immigrants from Turkey vs Syrian 3 or more Vehicles in Household Correlation Chart
The statistical analysis conducted on geographies consisting of 222,920,746 people shows a near-perfect positive correlation between the proportion of Immigrants from Turkey and percentage of households with 3 or more vehicles available in the United States with a correlation coefficient (R) of 0.946 and weighted average of 17.9%. Similarly, the statistical analysis conducted on geographies consisting of 266,128,737 people shows a strong positive correlation between the proportion of Syrians and percentage of households with 3 or more vehicles available in the United States with a correlation coefficient (R) of 0.775 and weighted average of 19.5%, a difference of 8.8%.
3 or more Vehicles in Household Correlation Summary
| Measurement | Immigrants from Turkey | Syrian |
| Minimum | 10.4% | 3.6% |
| Maximum | 62.2% | 100.0% |
| Range | 51.8% | 96.4% |
| Mean | 20.0% | 27.2% |
| Median | 18.0% | 22.0% |
| Interquartile 25% (IQ1) | 16.8% | 18.5% |
| Interquartile 75% (IQ3) | 20.6% | 31.2% |
| Interquartile Range (IQR) | 3.7% | 12.6% |
| Standard Deviation (Sample) | 10.7% | 18.0% |
| Standard Deviation (Population) | 10.4% | 17.8% |
Similar Demographics by 3 or more Vehicles in Household
Demographics Similar to Immigrants from Turkey by 3 or more Vehicles in Household
In terms of 3 or more vehicles in household, the demographic groups most similar to Immigrants from Turkey are Immigrants from Ethiopia (17.9%, a difference of 0.030%), Ethiopian (17.9%, a difference of 0.030%), Subsaharan African (17.9%, a difference of 0.15%), Immigrants from Eritrea (17.8%, a difference of 0.20%), and Sudanese (17.8%, a difference of 0.20%).
| Demographics | Rating | Rank | 3 or more Vehicles in Household |
| Immigrants | Eastern Africa | 1.8 /100 | #248 | Tragic 18.0% |
| Immigrants | Saudi Arabia | 1.7 /100 | #249 | Tragic 18.0% |
| Venezuelans | 1.7 /100 | #250 | Tragic 18.0% |
| Alsatians | 1.5 /100 | #251 | Tragic 18.0% |
| Immigrants | Southern Europe | 1.4 /100 | #252 | Tragic 17.9% |
| Immigrants | Ethiopia | 1.3 /100 | #253 | Tragic 17.9% |
| Ethiopians | 1.2 /100 | #254 | Tragic 17.9% |
| Immigrants | Turkey | 1.2 /100 | #255 | Tragic 17.9% |
| Sub-Saharan Africans | 1.1 /100 | #256 | Tragic 17.9% |
| Immigrants | Eritrea | 1.1 /100 | #257 | Tragic 17.8% |
| Sudanese | 1.1 /100 | #258 | Tragic 17.8% |
| Uruguayans | 1.0 /100 | #259 | Tragic 17.8% |
| Ugandans | 0.9 /100 | #260 | Tragic 17.8% |
| Immigrants | Northern Africa | 0.9 /100 | #261 | Tragic 17.8% |
| Colombians | 0.9 /100 | #262 | Tragic 17.8% |
Demographics Similar to Syrians by 3 or more Vehicles in Household
In terms of 3 or more vehicles in household, the demographic groups most similar to Syrians are Iroquois (19.4%, a difference of 0.070%), Immigrants from South Africa (19.5%, a difference of 0.23%), Immigrants from Northern Europe (19.5%, a difference of 0.25%), Kiowa (19.5%, a difference of 0.30%), and Immigrants from Peru (19.4%, a difference of 0.45%).
| Demographics | Rating | Rank | 3 or more Vehicles in Household |
| Peruvians | 58.8 /100 | #168 | Average 19.6% |
| Immigrants | Denmark | 57.6 /100 | #169 | Average 19.6% |
| Iraqis | 56.0 /100 | #170 | Average 19.6% |
| Immigrants | Western Europe | 53.2 /100 | #171 | Average 19.5% |
| Kiowa | 50.9 /100 | #172 | Average 19.5% |
| Immigrants | Northern Europe | 50.2 /100 | #173 | Average 19.5% |
| Immigrants | South Africa | 50.0 /100 | #174 | Average 19.5% |
| Syrians | 47.0 /100 | #175 | Average 19.5% |
| Iroquois | 46.0 /100 | #176 | Average 19.4% |
| Immigrants | Peru | 41.1 /100 | #177 | Average 19.4% |
| Immigrants | Syria | 40.3 /100 | #178 | Average 19.4% |
| Immigrants | South Central Asia | 38.9 /100 | #179 | Fair 19.3% |
| South Africans | 37.5 /100 | #180 | Fair 19.3% |
| Romanians | 37.1 /100 | #181 | Fair 19.3% |
| Cubans | 36.6 /100 | #182 | Fair 19.3% |