U.S. Virgin Islander vs Syrian 3 or more Vehicles in Household
COMPARE
U.S. Virgin Islander
Syrian
3 or more Vehicles in Household
3 or more Vehicles in Household Comparison
U.S. Virgin Islanders
Syrians
15.4%
3 OR MORE VEHICLES IN HOUSEHOLD
0.0/ 100
METRIC RATING
316th/ 347
METRIC RANK
19.5%
3 OR MORE VEHICLES IN HOUSEHOLD
47.0/ 100
METRIC RATING
175th/ 347
METRIC RANK
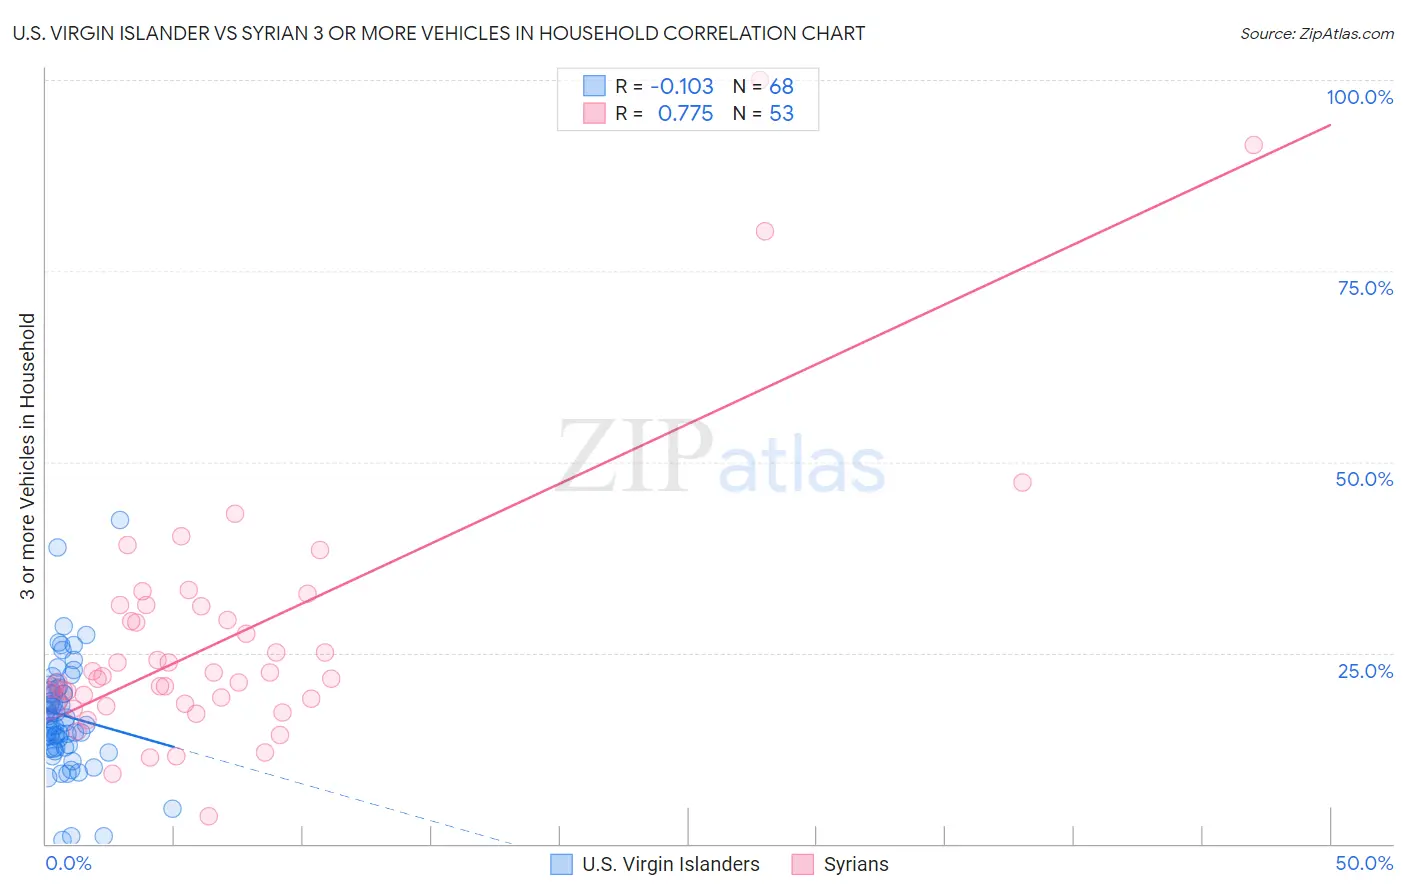
U.S. Virgin Islander vs Syrian 3 or more Vehicles in Household Correlation Chart
The statistical analysis conducted on geographies consisting of 87,505,701 people shows a poor negative correlation between the proportion of U.S. Virgin Islanders and percentage of households with 3 or more vehicles available in the United States with a correlation coefficient (R) of -0.103 and weighted average of 15.4%. Similarly, the statistical analysis conducted on geographies consisting of 266,128,737 people shows a strong positive correlation between the proportion of Syrians and percentage of households with 3 or more vehicles available in the United States with a correlation coefficient (R) of 0.775 and weighted average of 19.5%, a difference of 26.4%.
3 or more Vehicles in Household Correlation Summary
| Measurement | U.S. Virgin Islander | Syrian |
| Minimum | 0.49% | 3.6% |
| Maximum | 42.4% | 100.0% |
| Range | 41.9% | 96.4% |
| Mean | 16.8% | 27.2% |
| Median | 16.2% | 22.0% |
| Interquartile 25% (IQ1) | 12.6% | 18.5% |
| Interquartile 75% (IQ3) | 20.2% | 31.2% |
| Interquartile Range (IQR) | 7.6% | 12.6% |
| Standard Deviation (Sample) | 7.3% | 18.0% |
| Standard Deviation (Population) | 7.2% | 17.8% |
Similar Demographics by 3 or more Vehicles in Household
Demographics Similar to U.S. Virgin Islanders by 3 or more Vehicles in Household
In terms of 3 or more vehicles in household, the demographic groups most similar to U.S. Virgin Islanders are Haitian (15.5%, a difference of 0.52%), Immigrants from Belarus (15.5%, a difference of 0.84%), Jamaican (15.2%, a difference of 1.2%), Immigrants from Haiti (15.2%, a difference of 1.4%), and Immigrants from Israel (15.6%, a difference of 1.5%).
| Demographics | Rating | Rank | 3 or more Vehicles in Household |
| Immigrants | Somalia | 0.0 /100 | #309 | Tragic 15.9% |
| Moroccans | 0.0 /100 | #310 | Tragic 15.9% |
| Albanians | 0.0 /100 | #311 | Tragic 15.8% |
| Puerto Ricans | 0.0 /100 | #312 | Tragic 15.6% |
| Immigrants | Israel | 0.0 /100 | #313 | Tragic 15.6% |
| Immigrants | Belarus | 0.0 /100 | #314 | Tragic 15.5% |
| Haitians | 0.0 /100 | #315 | Tragic 15.5% |
| U.S. Virgin Islanders | 0.0 /100 | #316 | Tragic 15.4% |
| Jamaicans | 0.0 /100 | #317 | Tragic 15.2% |
| Immigrants | Haiti | 0.0 /100 | #318 | Tragic 15.2% |
| Cape Verdeans | 0.0 /100 | #319 | Tragic 15.0% |
| Yup'ik | 0.0 /100 | #320 | Tragic 14.8% |
| Immigrants | Jamaica | 0.0 /100 | #321 | Tragic 14.7% |
| Immigrants | West Indies | 0.0 /100 | #322 | Tragic 14.6% |
| Immigrants | Caribbean | 0.0 /100 | #323 | Tragic 14.6% |
Demographics Similar to Syrians by 3 or more Vehicles in Household
In terms of 3 or more vehicles in household, the demographic groups most similar to Syrians are Iroquois (19.4%, a difference of 0.070%), Immigrants from South Africa (19.5%, a difference of 0.23%), Immigrants from Northern Europe (19.5%, a difference of 0.25%), Kiowa (19.5%, a difference of 0.30%), and Immigrants from Peru (19.4%, a difference of 0.45%).
| Demographics | Rating | Rank | 3 or more Vehicles in Household |
| Peruvians | 58.8 /100 | #168 | Average 19.6% |
| Immigrants | Denmark | 57.6 /100 | #169 | Average 19.6% |
| Iraqis | 56.0 /100 | #170 | Average 19.6% |
| Immigrants | Western Europe | 53.2 /100 | #171 | Average 19.5% |
| Kiowa | 50.9 /100 | #172 | Average 19.5% |
| Immigrants | Northern Europe | 50.2 /100 | #173 | Average 19.5% |
| Immigrants | South Africa | 50.0 /100 | #174 | Average 19.5% |
| Syrians | 47.0 /100 | #175 | Average 19.5% |
| Iroquois | 46.0 /100 | #176 | Average 19.4% |
| Immigrants | Peru | 41.1 /100 | #177 | Average 19.4% |
| Immigrants | Syria | 40.3 /100 | #178 | Average 19.4% |
| Immigrants | South Central Asia | 38.9 /100 | #179 | Fair 19.3% |
| South Africans | 37.5 /100 | #180 | Fair 19.3% |
| Romanians | 37.1 /100 | #181 | Fair 19.3% |
| Cubans | 36.6 /100 | #182 | Fair 19.3% |