Nonimmigrants vs Syrian 3 or more Vehicles in Household
COMPARE
Nonimmigrants
Syrian
3 or more Vehicles in Household
3 or more Vehicles in Household Comparison
Nonimmigrants
Syrians
21.8%
3 OR MORE VEHICLES IN HOUSEHOLD
99.8/ 100
METRIC RATING
76th/ 347
METRIC RANK
19.5%
3 OR MORE VEHICLES IN HOUSEHOLD
47.0/ 100
METRIC RATING
175th/ 347
METRIC RANK
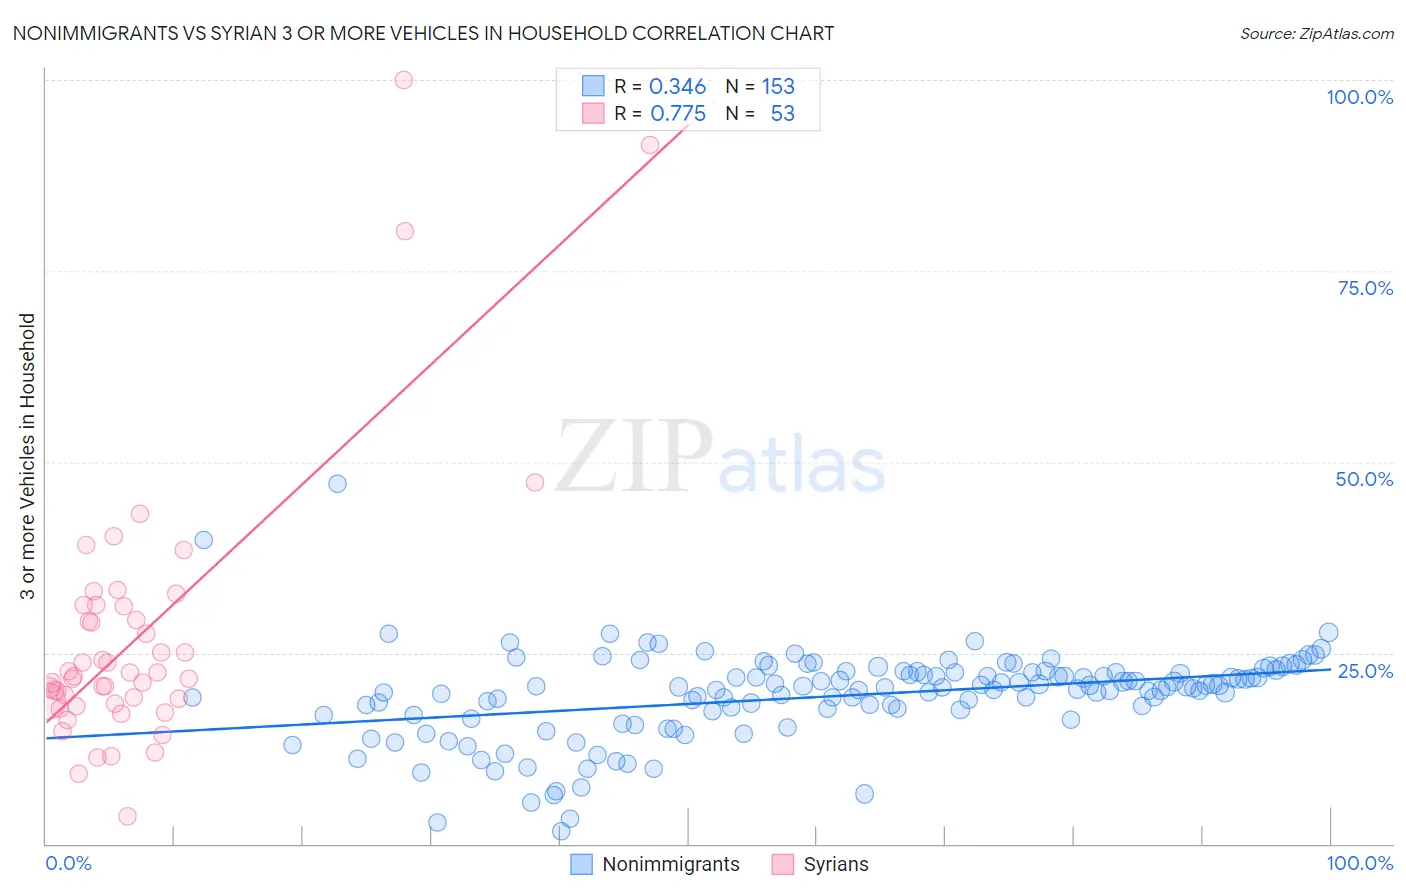
Nonimmigrants vs Syrian 3 or more Vehicles in Household Correlation Chart
The statistical analysis conducted on geographies consisting of 584,058,560 people shows a mild positive correlation between the proportion of Nonimmigrants and percentage of households with 3 or more vehicles available in the United States with a correlation coefficient (R) of 0.346 and weighted average of 21.8%. Similarly, the statistical analysis conducted on geographies consisting of 266,128,737 people shows a strong positive correlation between the proportion of Syrians and percentage of households with 3 or more vehicles available in the United States with a correlation coefficient (R) of 0.775 and weighted average of 19.5%, a difference of 11.9%.
3 or more Vehicles in Household Correlation Summary
| Measurement | Nonimmigrants | Syrian |
| Minimum | 1.6% | 3.6% |
| Maximum | 47.1% | 100.0% |
| Range | 45.5% | 96.4% |
| Mean | 19.3% | 27.2% |
| Median | 20.4% | 22.0% |
| Interquartile 25% (IQ1) | 17.2% | 18.5% |
| Interquartile 75% (IQ3) | 22.5% | 31.2% |
| Interquartile Range (IQR) | 5.3% | 12.6% |
| Standard Deviation (Sample) | 5.9% | 18.0% |
| Standard Deviation (Population) | 5.9% | 17.8% |
Similar Demographics by 3 or more Vehicles in Household
Demographics Similar to Nonimmigrants by 3 or more Vehicles in Household
In terms of 3 or more vehicles in household, the demographic groups most similar to Nonimmigrants are Japanese (21.8%, a difference of 0.040%), Irish (21.8%, a difference of 0.070%), Immigrants from Oceania (21.8%, a difference of 0.15%), Salvadoran (21.8%, a difference of 0.16%), and Czechoslovakian (21.7%, a difference of 0.20%).
| Demographics | Rating | Rank | 3 or more Vehicles in Household |
| Creek | 99.9 /100 | #69 | Exceptional 21.9% |
| Bangladeshis | 99.8 /100 | #70 | Exceptional 21.9% |
| Potawatomi | 99.8 /100 | #71 | Exceptional 21.9% |
| Portuguese | 99.8 /100 | #72 | Exceptional 21.8% |
| Salvadorans | 99.8 /100 | #73 | Exceptional 21.8% |
| Immigrants | Oceania | 99.8 /100 | #74 | Exceptional 21.8% |
| Japanese | 99.8 /100 | #75 | Exceptional 21.8% |
| Immigrants | Nonimmigrants | 99.8 /100 | #76 | Exceptional 21.8% |
| Irish | 99.8 /100 | #77 | Exceptional 21.8% |
| Czechoslovakians | 99.8 /100 | #78 | Exceptional 21.7% |
| Assyrians/Chaldeans/Syriacs | 99.8 /100 | #79 | Exceptional 21.7% |
| Afghans | 99.7 /100 | #80 | Exceptional 21.7% |
| Celtics | 99.7 /100 | #81 | Exceptional 21.7% |
| Immigrants | El Salvador | 99.6 /100 | #82 | Exceptional 21.5% |
| Chippewa | 99.6 /100 | #83 | Exceptional 21.5% |
Demographics Similar to Syrians by 3 or more Vehicles in Household
In terms of 3 or more vehicles in household, the demographic groups most similar to Syrians are Iroquois (19.4%, a difference of 0.070%), Immigrants from South Africa (19.5%, a difference of 0.23%), Immigrants from Northern Europe (19.5%, a difference of 0.25%), Kiowa (19.5%, a difference of 0.30%), and Immigrants from Peru (19.4%, a difference of 0.45%).
| Demographics | Rating | Rank | 3 or more Vehicles in Household |
| Peruvians | 58.8 /100 | #168 | Average 19.6% |
| Immigrants | Denmark | 57.6 /100 | #169 | Average 19.6% |
| Iraqis | 56.0 /100 | #170 | Average 19.6% |
| Immigrants | Western Europe | 53.2 /100 | #171 | Average 19.5% |
| Kiowa | 50.9 /100 | #172 | Average 19.5% |
| Immigrants | Northern Europe | 50.2 /100 | #173 | Average 19.5% |
| Immigrants | South Africa | 50.0 /100 | #174 | Average 19.5% |
| Syrians | 47.0 /100 | #175 | Average 19.5% |
| Iroquois | 46.0 /100 | #176 | Average 19.4% |
| Immigrants | Peru | 41.1 /100 | #177 | Average 19.4% |
| Immigrants | Syria | 40.3 /100 | #178 | Average 19.4% |
| Immigrants | South Central Asia | 38.9 /100 | #179 | Fair 19.3% |
| South Africans | 37.5 /100 | #180 | Fair 19.3% |
| Romanians | 37.1 /100 | #181 | Fair 19.3% |
| Cubans | 36.6 /100 | #182 | Fair 19.3% |