Immigrants from Norway vs Syrian Single Mother Households
COMPARE
Immigrants from Norway
Syrian
Single Mother Households
Single Mother Households Comparison
Immigrants from Norway
Syrians
5.6%
SINGLE MOTHER HOUSEHOLDS
98.7/ 100
METRIC RATING
60th/ 347
METRIC RANK
6.0%
SINGLE MOTHER HOUSEHOLDS
86.0/ 100
METRIC RATING
139th/ 347
METRIC RANK
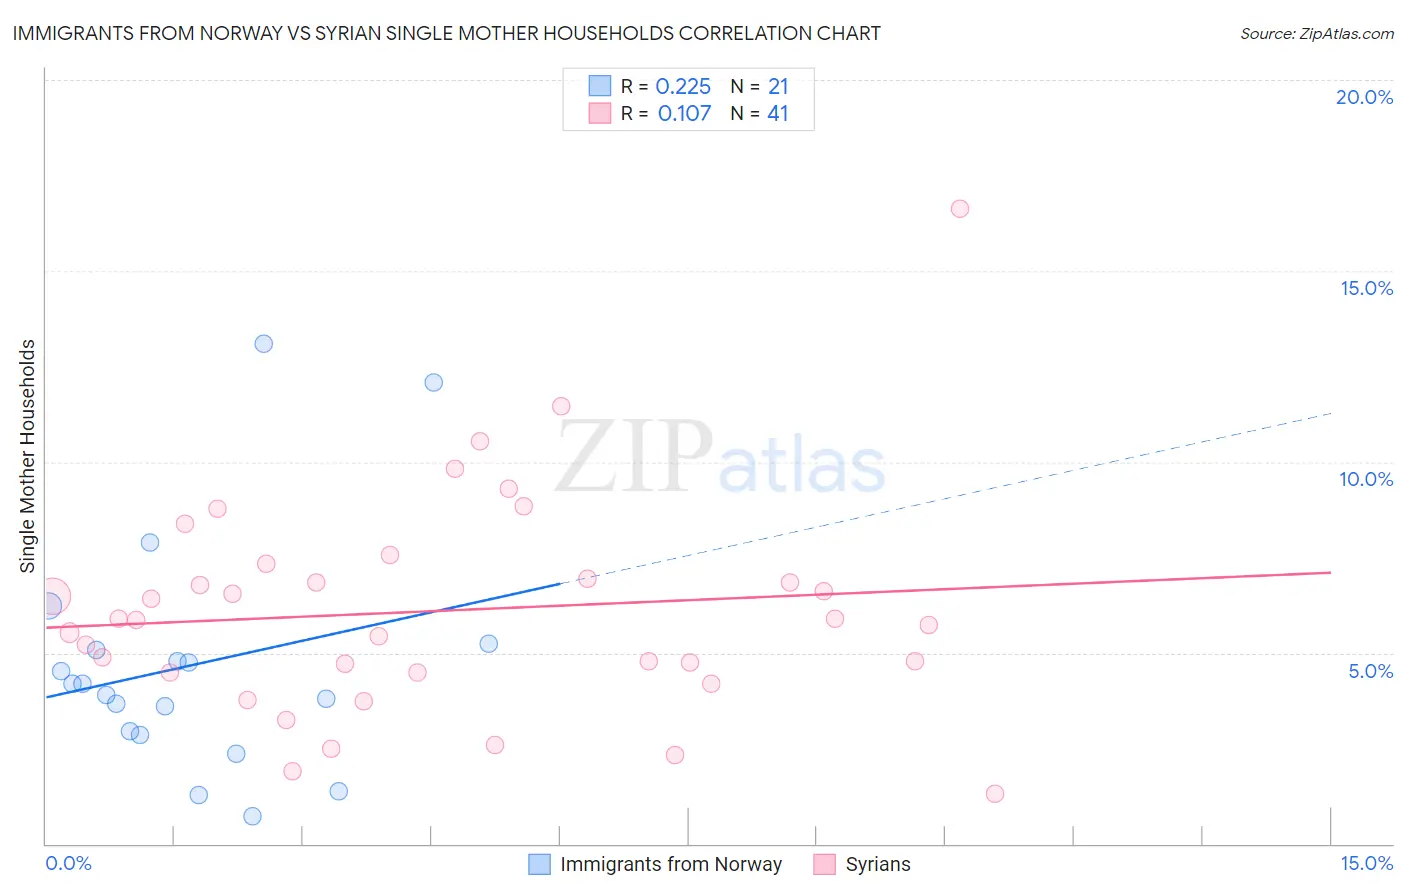
Immigrants from Norway vs Syrian Single Mother Households Correlation Chart
The statistical analysis conducted on geographies consisting of 116,559,086 people shows a weak positive correlation between the proportion of Immigrants from Norway and percentage of single mother households in the United States with a correlation coefficient (R) of 0.225 and weighted average of 5.6%. Similarly, the statistical analysis conducted on geographies consisting of 265,755,115 people shows a poor positive correlation between the proportion of Syrians and percentage of single mother households in the United States with a correlation coefficient (R) of 0.107 and weighted average of 6.0%, a difference of 7.7%.
Single Mother Households Correlation Summary
| Measurement | Immigrants from Norway | Syrian |
| Minimum | 0.71% | 1.3% |
| Maximum | 13.1% | 16.6% |
| Range | 12.4% | 15.3% |
| Mean | 4.7% | 6.1% |
| Median | 4.2% | 5.8% |
| Interquartile 25% (IQ1) | 2.9% | 4.5% |
| Interquartile 75% (IQ3) | 5.2% | 7.1% |
| Interquartile Range (IQR) | 2.3% | 2.7% |
| Standard Deviation (Sample) | 3.1% | 2.9% |
| Standard Deviation (Population) | 3.0% | 2.8% |
Similar Demographics by Single Mother Households
Demographics Similar to Immigrants from Norway by Single Mother Households
In terms of single mother households, the demographic groups most similar to Immigrants from Norway are Australian (5.6%, a difference of 0.070%), Polish (5.6%, a difference of 0.080%), Luxembourger (5.6%, a difference of 0.15%), Immigrants from North Macedonia (5.6%, a difference of 0.15%), and Immigrants from France (5.6%, a difference of 0.18%).
| Demographics | Rating | Rank | Single Mother Households |
| Immigrants | Russia | 99.1 /100 | #53 | Exceptional 5.5% |
| Immigrants | Lebanon | 99.1 /100 | #54 | Exceptional 5.5% |
| Immigrants | Denmark | 99.1 /100 | #55 | Exceptional 5.5% |
| Immigrants | Romania | 99.0 /100 | #56 | Exceptional 5.5% |
| Immigrants | Europe | 99.0 /100 | #57 | Exceptional 5.5% |
| Danes | 98.9 /100 | #58 | Exceptional 5.5% |
| Luxembourgers | 98.7 /100 | #59 | Exceptional 5.6% |
| Immigrants | Norway | 98.7 /100 | #60 | Exceptional 5.6% |
| Australians | 98.7 /100 | #61 | Exceptional 5.6% |
| Poles | 98.6 /100 | #62 | Exceptional 5.6% |
| Immigrants | North Macedonia | 98.6 /100 | #63 | Exceptional 5.6% |
| Immigrants | France | 98.6 /100 | #64 | Exceptional 5.6% |
| Greeks | 98.6 /100 | #65 | Exceptional 5.6% |
| Immigrants | Canada | 98.5 /100 | #66 | Exceptional 5.6% |
| Italians | 98.5 /100 | #67 | Exceptional 5.6% |
Demographics Similar to Syrians by Single Mother Households
In terms of single mother households, the demographic groups most similar to Syrians are French (6.0%, a difference of 0.070%), Tsimshian (6.0%, a difference of 0.17%), Immigrants from Egypt (6.0%, a difference of 0.22%), Icelander (6.0%, a difference of 0.23%), and Immigrants from Iraq (6.0%, a difference of 0.26%).
| Demographics | Rating | Rank | Single Mother Households |
| Albanians | 91.1 /100 | #132 | Exceptional 5.9% |
| Egyptians | 90.7 /100 | #133 | Exceptional 5.9% |
| Canadians | 90.5 /100 | #134 | Exceptional 5.9% |
| Immigrants | Saudi Arabia | 90.2 /100 | #135 | Exceptional 5.9% |
| Jordanians | 88.9 /100 | #136 | Excellent 6.0% |
| Immigrants | Pakistan | 88.4 /100 | #137 | Excellent 6.0% |
| Icelanders | 86.9 /100 | #138 | Excellent 6.0% |
| Syrians | 86.0 /100 | #139 | Excellent 6.0% |
| French | 85.7 /100 | #140 | Excellent 6.0% |
| Tsimshian | 85.2 /100 | #141 | Excellent 6.0% |
| Immigrants | Egypt | 85.0 /100 | #142 | Excellent 6.0% |
| Immigrants | Iraq | 84.8 /100 | #143 | Excellent 6.0% |
| Koreans | 84.4 /100 | #144 | Excellent 6.0% |
| Arabs | 84.0 /100 | #145 | Excellent 6.0% |
| French Canadians | 82.6 /100 | #146 | Excellent 6.0% |