Immigrants from Iraq vs Syrian 3 or more Vehicles in Household
COMPARE
Immigrants from Iraq
Syrian
3 or more Vehicles in Household
3 or more Vehicles in Household Comparison
Immigrants from Iraq
Syrians
20.2%
3 OR MORE VEHICLES IN HOUSEHOLD
87.1/ 100
METRIC RATING
137th/ 347
METRIC RANK
19.5%
3 OR MORE VEHICLES IN HOUSEHOLD
47.0/ 100
METRIC RATING
175th/ 347
METRIC RANK
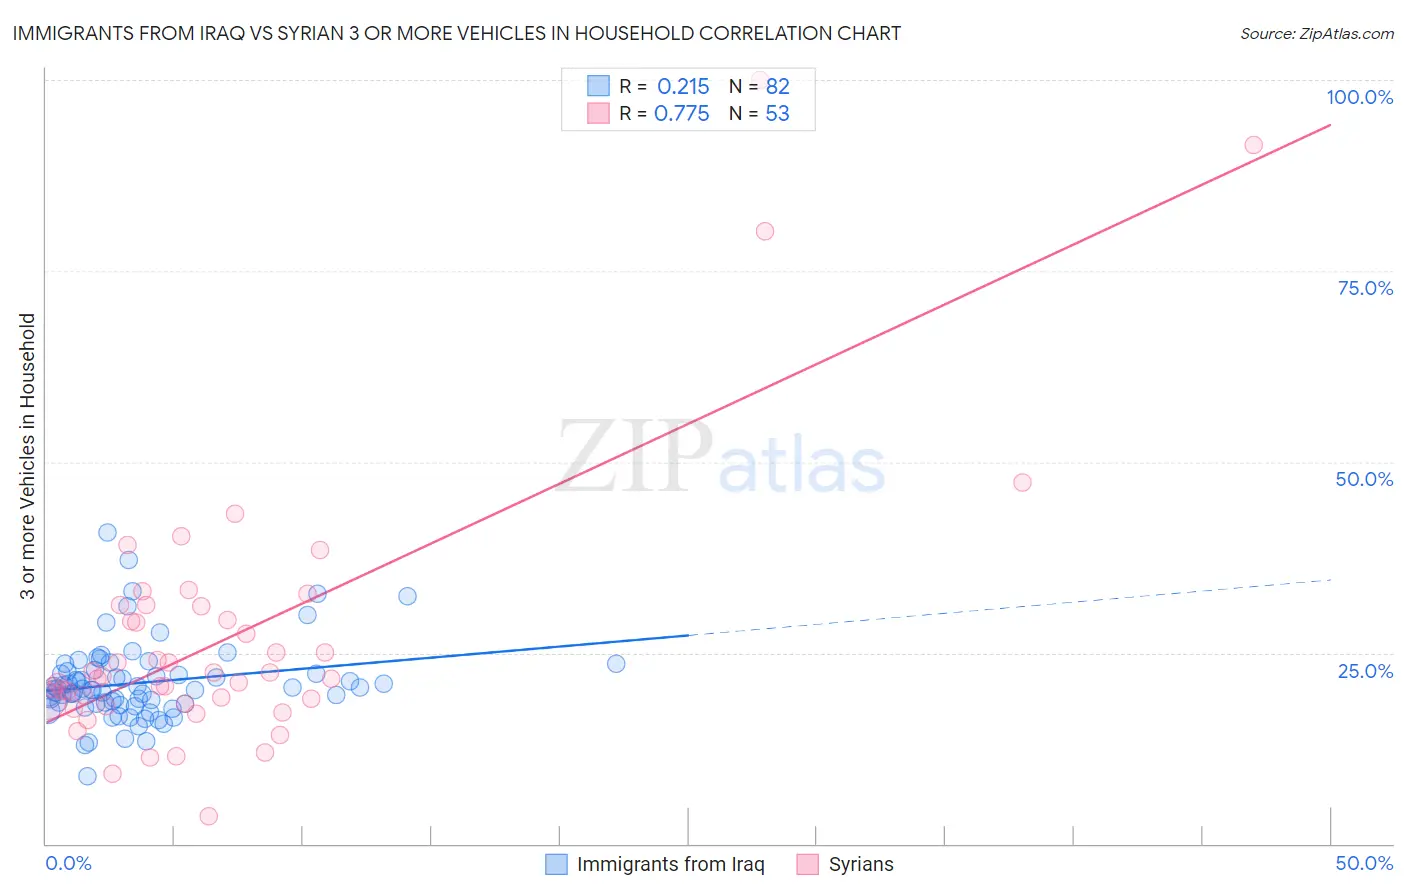
Immigrants from Iraq vs Syrian 3 or more Vehicles in Household Correlation Chart
The statistical analysis conducted on geographies consisting of 194,713,443 people shows a weak positive correlation between the proportion of Immigrants from Iraq and percentage of households with 3 or more vehicles available in the United States with a correlation coefficient (R) of 0.215 and weighted average of 20.2%. Similarly, the statistical analysis conducted on geographies consisting of 266,128,737 people shows a strong positive correlation between the proportion of Syrians and percentage of households with 3 or more vehicles available in the United States with a correlation coefficient (R) of 0.775 and weighted average of 19.5%, a difference of 3.8%.
3 or more Vehicles in Household Correlation Summary
| Measurement | Immigrants from Iraq | Syrian |
| Minimum | 8.9% | 3.6% |
| Maximum | 40.8% | 100.0% |
| Range | 32.0% | 96.4% |
| Mean | 21.1% | 27.2% |
| Median | 20.2% | 22.0% |
| Interquartile 25% (IQ1) | 18.4% | 18.5% |
| Interquartile 75% (IQ3) | 22.5% | 31.2% |
| Interquartile Range (IQR) | 4.2% | 12.6% |
| Standard Deviation (Sample) | 5.2% | 18.0% |
| Standard Deviation (Population) | 5.2% | 17.8% |
Similar Demographics by 3 or more Vehicles in Household
Demographics Similar to Immigrants from Iraq by 3 or more Vehicles in Household
In terms of 3 or more vehicles in household, the demographic groups most similar to Immigrants from Iraq are Immigrants from Nicaragua (20.2%, a difference of 0.0%), Immigrants from India (20.2%, a difference of 0.010%), Polish (20.2%, a difference of 0.040%), Immigrants from North America (20.2%, a difference of 0.12%), and Aleut (20.2%, a difference of 0.12%).
| Demographics | Rating | Rank | 3 or more Vehicles in Household |
| Greeks | 88.6 /100 | #130 | Excellent 20.3% |
| Immigrants | Asia | 88.1 /100 | #131 | Excellent 20.2% |
| Immigrants | Canada | 87.8 /100 | #132 | Excellent 20.2% |
| Immigrants | North America | 87.8 /100 | #133 | Excellent 20.2% |
| Poles | 87.3 /100 | #134 | Excellent 20.2% |
| Immigrants | India | 87.2 /100 | #135 | Excellent 20.2% |
| Immigrants | Nicaragua | 87.1 /100 | #136 | Excellent 20.2% |
| Immigrants | Iraq | 87.1 /100 | #137 | Excellent 20.2% |
| Aleuts | 86.3 /100 | #138 | Excellent 20.2% |
| Slovenes | 85.5 /100 | #139 | Excellent 20.2% |
| French American Indians | 85.3 /100 | #140 | Excellent 20.1% |
| Ottawa | 84.9 /100 | #141 | Excellent 20.1% |
| Jordanians | 84.4 /100 | #142 | Excellent 20.1% |
| Lithuanians | 84.4 /100 | #143 | Excellent 20.1% |
| Iranians | 84.0 /100 | #144 | Excellent 20.1% |
Demographics Similar to Syrians by 3 or more Vehicles in Household
In terms of 3 or more vehicles in household, the demographic groups most similar to Syrians are Iroquois (19.4%, a difference of 0.070%), Immigrants from South Africa (19.5%, a difference of 0.23%), Immigrants from Northern Europe (19.5%, a difference of 0.25%), Kiowa (19.5%, a difference of 0.30%), and Immigrants from Peru (19.4%, a difference of 0.45%).
| Demographics | Rating | Rank | 3 or more Vehicles in Household |
| Peruvians | 58.8 /100 | #168 | Average 19.6% |
| Immigrants | Denmark | 57.6 /100 | #169 | Average 19.6% |
| Iraqis | 56.0 /100 | #170 | Average 19.6% |
| Immigrants | Western Europe | 53.2 /100 | #171 | Average 19.5% |
| Kiowa | 50.9 /100 | #172 | Average 19.5% |
| Immigrants | Northern Europe | 50.2 /100 | #173 | Average 19.5% |
| Immigrants | South Africa | 50.0 /100 | #174 | Average 19.5% |
| Syrians | 47.0 /100 | #175 | Average 19.5% |
| Iroquois | 46.0 /100 | #176 | Average 19.4% |
| Immigrants | Peru | 41.1 /100 | #177 | Average 19.4% |
| Immigrants | Syria | 40.3 /100 | #178 | Average 19.4% |
| Immigrants | South Central Asia | 38.9 /100 | #179 | Fair 19.3% |
| South Africans | 37.5 /100 | #180 | Fair 19.3% |
| Romanians | 37.1 /100 | #181 | Fair 19.3% |
| Cubans | 36.6 /100 | #182 | Fair 19.3% |