Immigrants from Norway vs Inupiat 3 or more Vehicles in Household
COMPARE
Immigrants from Norway
Inupiat
3 or more Vehicles in Household
3 or more Vehicles in Household Comparison
Immigrants from Norway
Inupiat
19.0%
3 OR MORE VEHICLES IN HOUSEHOLD
19.0/ 100
METRIC RATING
199th/ 347
METRIC RANK
16.9%
3 OR MORE VEHICLES IN HOUSEHOLD
0.1/ 100
METRIC RATING
296th/ 347
METRIC RANK
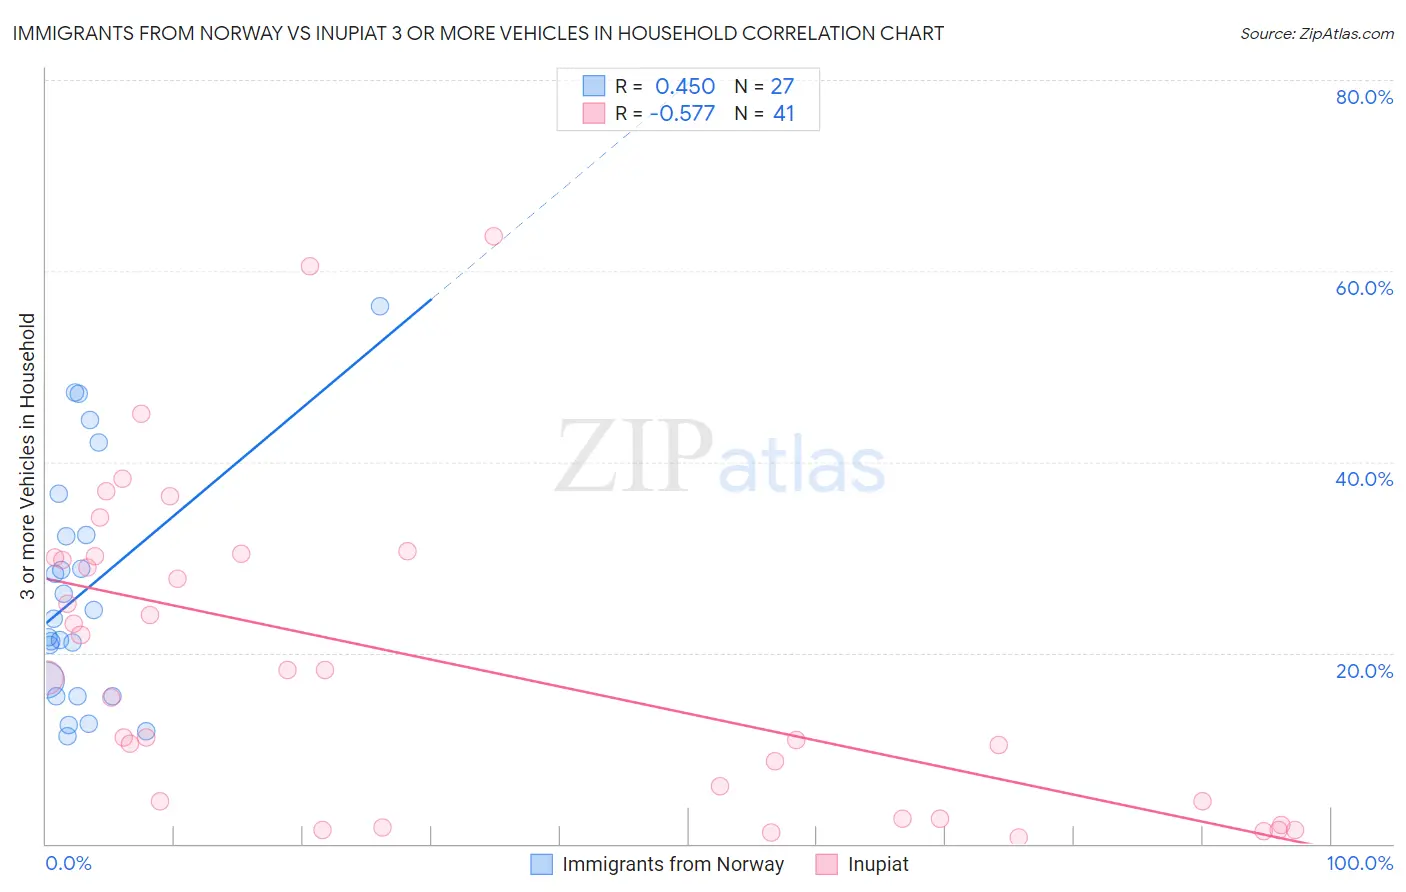
Immigrants from Norway vs Inupiat 3 or more Vehicles in Household Correlation Chart
The statistical analysis conducted on geographies consisting of 116,675,464 people shows a moderate positive correlation between the proportion of Immigrants from Norway and percentage of households with 3 or more vehicles available in the United States with a correlation coefficient (R) of 0.450 and weighted average of 19.0%. Similarly, the statistical analysis conducted on geographies consisting of 96,277,833 people shows a substantial negative correlation between the proportion of Inupiat and percentage of households with 3 or more vehicles available in the United States with a correlation coefficient (R) of -0.577 and weighted average of 16.9%, a difference of 12.5%.
3 or more Vehicles in Household Correlation Summary
| Measurement | Immigrants from Norway | Inupiat |
| Minimum | 11.3% | 0.71% |
| Maximum | 56.2% | 63.6% |
| Range | 45.0% | 62.9% |
| Mean | 26.5% | 19.0% |
| Median | 23.6% | 17.4% |
| Interquartile 25% (IQ1) | 15.5% | 3.5% |
| Interquartile 75% (IQ3) | 32.3% | 30.0% |
| Interquartile Range (IQR) | 16.8% | 26.5% |
| Standard Deviation (Sample) | 12.3% | 16.3% |
| Standard Deviation (Population) | 12.1% | 16.1% |
Similar Demographics by 3 or more Vehicles in Household
Demographics Similar to Immigrants from Norway by 3 or more Vehicles in Household
In terms of 3 or more vehicles in household, the demographic groups most similar to Immigrants from Norway are Egyptian (19.0%, a difference of 0.060%), Argentinean (18.9%, a difference of 0.10%), Arab (18.9%, a difference of 0.16%), Immigrants from Japan (19.0%, a difference of 0.36%), and Central American Indian (19.0%, a difference of 0.39%).
| Demographics | Rating | Rank | 3 or more Vehicles in Household |
| Kenyans | 24.7 /100 | #192 | Fair 19.1% |
| Tsimshian | 24.4 /100 | #193 | Fair 19.1% |
| Serbians | 24.0 /100 | #194 | Fair 19.1% |
| Immigrants | Moldova | 23.6 /100 | #195 | Fair 19.1% |
| Central American Indians | 22.2 /100 | #196 | Fair 19.0% |
| Immigrants | Japan | 22.0 /100 | #197 | Fair 19.0% |
| Egyptians | 19.5 /100 | #198 | Poor 19.0% |
| Immigrants | Norway | 19.0 /100 | #199 | Poor 19.0% |
| Argentineans | 18.2 /100 | #200 | Poor 18.9% |
| Arabs | 17.7 /100 | #201 | Poor 18.9% |
| Immigrants | Austria | 15.4 /100 | #202 | Poor 18.9% |
| Tohono O'odham | 14.8 /100 | #203 | Poor 18.9% |
| Immigrants | Romania | 14.6 /100 | #204 | Poor 18.9% |
| Russians | 14.2 /100 | #205 | Poor 18.8% |
| Immigrants | Eastern Asia | 14.1 /100 | #206 | Poor 18.8% |
Demographics Similar to Inupiat by 3 or more Vehicles in Household
In terms of 3 or more vehicles in household, the demographic groups most similar to Inupiat are Immigrants from Russia (16.9%, a difference of 0.36%), Immigrants from Western Africa (16.9%, a difference of 0.41%), Israeli (16.8%, a difference of 0.47%), Bahamian (16.9%, a difference of 0.52%), and Immigrants from Spain (17.0%, a difference of 0.60%).
| Demographics | Rating | Rank | 3 or more Vehicles in Household |
| Immigrants | Liberia | 0.1 /100 | #289 | Tragic 17.1% |
| Liberians | 0.1 /100 | #290 | Tragic 17.0% |
| Immigrants | Congo | 0.1 /100 | #291 | Tragic 17.0% |
| Immigrants | Spain | 0.1 /100 | #292 | Tragic 17.0% |
| Bahamians | 0.1 /100 | #293 | Tragic 16.9% |
| Immigrants | Western Africa | 0.1 /100 | #294 | Tragic 16.9% |
| Immigrants | Russia | 0.1 /100 | #295 | Tragic 16.9% |
| Inupiat | 0.1 /100 | #296 | Tragic 16.9% |
| Israelis | 0.1 /100 | #297 | Tragic 16.8% |
| Immigrants | Zaire | 0.1 /100 | #298 | Tragic 16.7% |
| Immigrants | South America | 0.1 /100 | #299 | Tragic 16.7% |
| Cypriots | 0.0 /100 | #300 | Tragic 16.6% |
| Paraguayans | 0.0 /100 | #301 | Tragic 16.6% |
| Immigrants | Greece | 0.0 /100 | #302 | Tragic 16.5% |
| Immigrants | Serbia | 0.0 /100 | #303 | Tragic 16.4% |