Immigrants from Norway vs Immigrants from Israel 3 or more Vehicles in Household
COMPARE
Immigrants from Norway
Immigrants from Israel
3 or more Vehicles in Household
3 or more Vehicles in Household Comparison
Immigrants from Norway
Immigrants from Israel
19.0%
3 OR MORE VEHICLES IN HOUSEHOLD
19.0/ 100
METRIC RATING
199th/ 347
METRIC RANK
15.6%
3 OR MORE VEHICLES IN HOUSEHOLD
0.0/ 100
METRIC RATING
313th/ 347
METRIC RANK
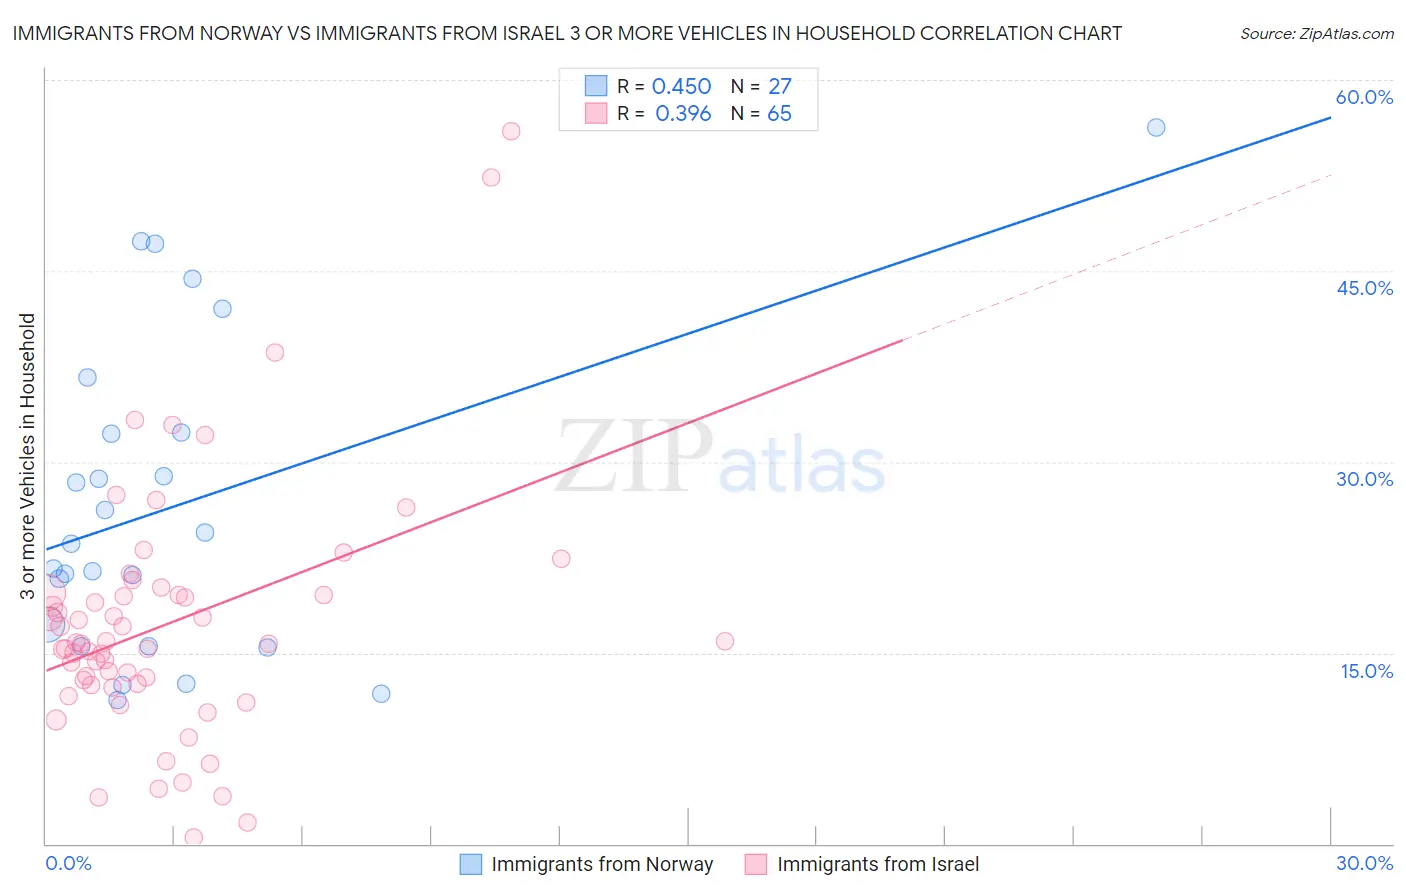
Immigrants from Norway vs Immigrants from Israel 3 or more Vehicles in Household Correlation Chart
The statistical analysis conducted on geographies consisting of 116,675,464 people shows a moderate positive correlation between the proportion of Immigrants from Norway and percentage of households with 3 or more vehicles available in the United States with a correlation coefficient (R) of 0.450 and weighted average of 19.0%. Similarly, the statistical analysis conducted on geographies consisting of 209,931,156 people shows a mild positive correlation between the proportion of Immigrants from Israel and percentage of households with 3 or more vehicles available in the United States with a correlation coefficient (R) of 0.396 and weighted average of 15.6%, a difference of 21.4%.
3 or more Vehicles in Household Correlation Summary
| Measurement | Immigrants from Norway | Immigrants from Israel |
| Minimum | 11.3% | 0.45% |
| Maximum | 56.2% | 55.9% |
| Range | 45.0% | 55.5% |
| Mean | 26.5% | 17.3% |
| Median | 23.6% | 15.7% |
| Interquartile 25% (IQ1) | 15.5% | 12.5% |
| Interquartile 75% (IQ3) | 32.3% | 19.6% |
| Interquartile Range (IQR) | 16.8% | 7.1% |
| Standard Deviation (Sample) | 12.3% | 9.9% |
| Standard Deviation (Population) | 12.1% | 9.9% |
Similar Demographics by 3 or more Vehicles in Household
Demographics Similar to Immigrants from Norway by 3 or more Vehicles in Household
In terms of 3 or more vehicles in household, the demographic groups most similar to Immigrants from Norway are Egyptian (19.0%, a difference of 0.060%), Argentinean (18.9%, a difference of 0.10%), Arab (18.9%, a difference of 0.16%), Immigrants from Japan (19.0%, a difference of 0.36%), and Central American Indian (19.0%, a difference of 0.39%).
| Demographics | Rating | Rank | 3 or more Vehicles in Household |
| Kenyans | 24.7 /100 | #192 | Fair 19.1% |
| Tsimshian | 24.4 /100 | #193 | Fair 19.1% |
| Serbians | 24.0 /100 | #194 | Fair 19.1% |
| Immigrants | Moldova | 23.6 /100 | #195 | Fair 19.1% |
| Central American Indians | 22.2 /100 | #196 | Fair 19.0% |
| Immigrants | Japan | 22.0 /100 | #197 | Fair 19.0% |
| Egyptians | 19.5 /100 | #198 | Poor 19.0% |
| Immigrants | Norway | 19.0 /100 | #199 | Poor 19.0% |
| Argentineans | 18.2 /100 | #200 | Poor 18.9% |
| Arabs | 17.7 /100 | #201 | Poor 18.9% |
| Immigrants | Austria | 15.4 /100 | #202 | Poor 18.9% |
| Tohono O'odham | 14.8 /100 | #203 | Poor 18.9% |
| Immigrants | Romania | 14.6 /100 | #204 | Poor 18.9% |
| Russians | 14.2 /100 | #205 | Poor 18.8% |
| Immigrants | Eastern Asia | 14.1 /100 | #206 | Poor 18.8% |
Demographics Similar to Immigrants from Israel by 3 or more Vehicles in Household
In terms of 3 or more vehicles in household, the demographic groups most similar to Immigrants from Israel are Puerto Rican (15.6%, a difference of 0.020%), Immigrants from Belarus (15.5%, a difference of 0.64%), Haitian (15.5%, a difference of 0.96%), Albanian (15.8%, a difference of 1.2%), and U.S. Virgin Islander (15.4%, a difference of 1.5%).
| Demographics | Rating | Rank | 3 or more Vehicles in Household |
| Somalis | 0.0 /100 | #306 | Tragic 16.2% |
| Immigrants | Ghana | 0.0 /100 | #307 | Tragic 16.2% |
| Houma | 0.0 /100 | #308 | Tragic 16.1% |
| Immigrants | Somalia | 0.0 /100 | #309 | Tragic 15.9% |
| Moroccans | 0.0 /100 | #310 | Tragic 15.9% |
| Albanians | 0.0 /100 | #311 | Tragic 15.8% |
| Puerto Ricans | 0.0 /100 | #312 | Tragic 15.6% |
| Immigrants | Israel | 0.0 /100 | #313 | Tragic 15.6% |
| Immigrants | Belarus | 0.0 /100 | #314 | Tragic 15.5% |
| Haitians | 0.0 /100 | #315 | Tragic 15.5% |
| U.S. Virgin Islanders | 0.0 /100 | #316 | Tragic 15.4% |
| Jamaicans | 0.0 /100 | #317 | Tragic 15.2% |
| Immigrants | Haiti | 0.0 /100 | #318 | Tragic 15.2% |
| Cape Verdeans | 0.0 /100 | #319 | Tragic 15.0% |
| Yup'ik | 0.0 /100 | #320 | Tragic 14.8% |