Immigrants from Latvia vs Croatian 2 or more Vehicles in Household
COMPARE
Immigrants from Latvia
Croatian
2 or more Vehicles in Household
2 or more Vehicles in Household Comparison
Immigrants from Latvia
Croatians
52.2%
2 OR MORE VEHICLES IN HOUSEHOLD
0.4/ 100
METRIC RATING
264th/ 347
METRIC RANK
58.6%
2 OR MORE VEHICLES IN HOUSEHOLD
99.7/ 100
METRIC RATING
66th/ 347
METRIC RANK
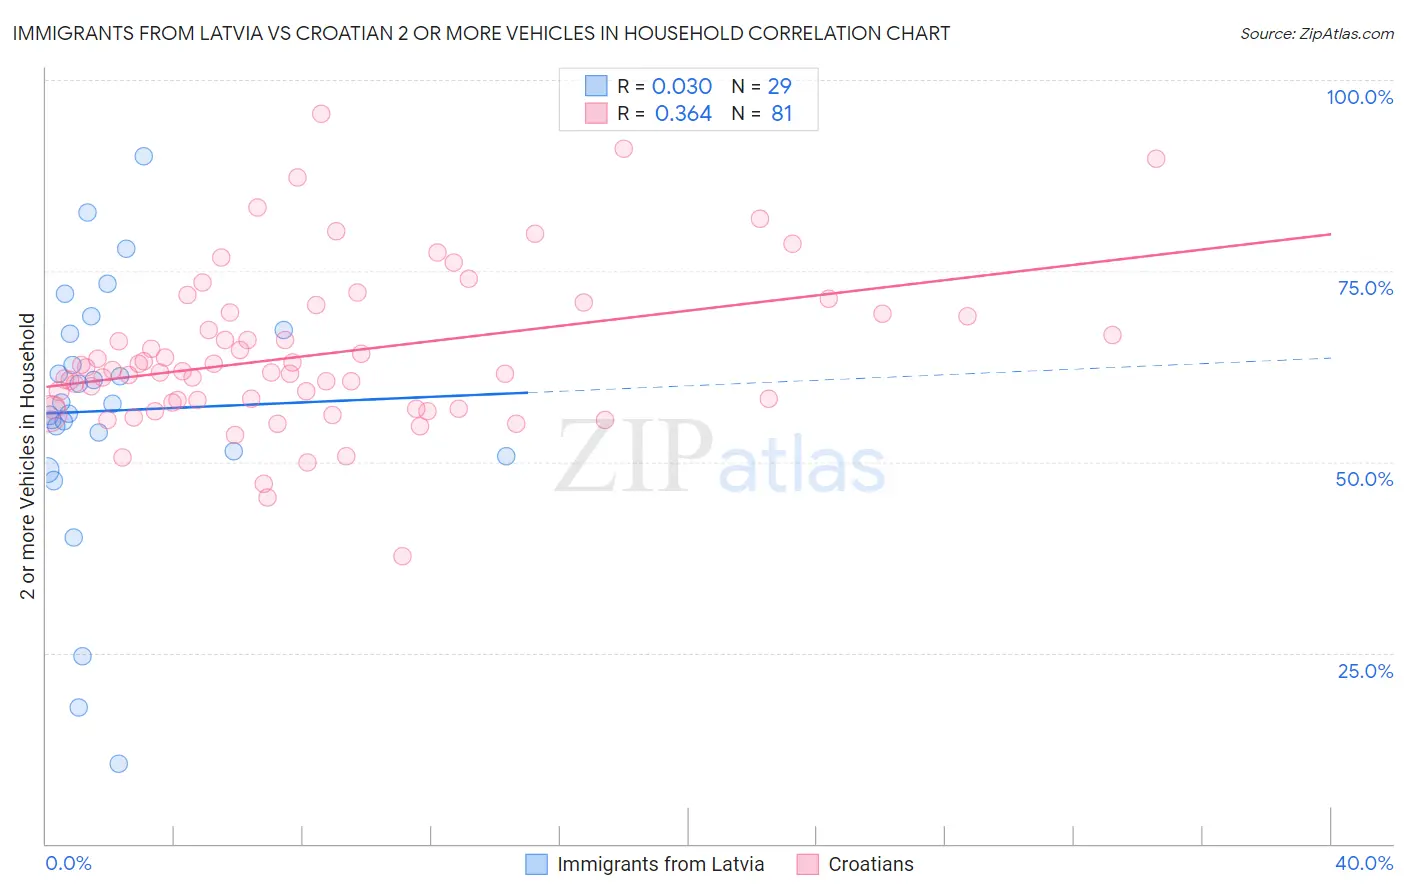
Immigrants from Latvia vs Croatian 2 or more Vehicles in Household Correlation Chart
The statistical analysis conducted on geographies consisting of 113,732,153 people shows no correlation between the proportion of Immigrants from Latvia and percentage of households with 2 or more vehicles available in the United States with a correlation coefficient (R) of 0.030 and weighted average of 52.2%. Similarly, the statistical analysis conducted on geographies consisting of 375,571,989 people shows a mild positive correlation between the proportion of Croatians and percentage of households with 2 or more vehicles available in the United States with a correlation coefficient (R) of 0.364 and weighted average of 58.6%, a difference of 12.1%.
2 or more Vehicles in Household Correlation Summary
| Measurement | Immigrants from Latvia | Croatian |
| Minimum | 10.4% | 37.6% |
| Maximum | 89.9% | 95.6% |
| Range | 79.5% | 57.9% |
| Mean | 56.7% | 64.1% |
| Median | 57.6% | 61.9% |
| Interquartile 25% (IQ1) | 51.0% | 57.4% |
| Interquartile 75% (IQ3) | 67.1% | 69.4% |
| Interquartile Range (IQR) | 16.0% | 12.0% |
| Standard Deviation (Sample) | 17.3% | 10.4% |
| Standard Deviation (Population) | 17.0% | 10.3% |
Similar Demographics by 2 or more Vehicles in Household
Demographics Similar to Immigrants from Latvia by 2 or more Vehicles in Household
In terms of 2 or more vehicles in household, the demographic groups most similar to Immigrants from Latvia are Immigrants from Southern Europe (52.3%, a difference of 0.040%), Immigrants from Northern Africa (52.3%, a difference of 0.17%), Immigrants from Congo (52.1%, a difference of 0.24%), Immigrants from Australia (52.4%, a difference of 0.37%), and Immigrants from France (52.0%, a difference of 0.39%).
| Demographics | Rating | Rank | 2 or more Vehicles in Household |
| Immigrants | Hong Kong | 0.6 /100 | #257 | Tragic 52.6% |
| Central American Indians | 0.6 /100 | #258 | Tragic 52.5% |
| Alsatians | 0.6 /100 | #259 | Tragic 52.5% |
| Immigrants | Bahamas | 0.5 /100 | #260 | Tragic 52.5% |
| Immigrants | Australia | 0.5 /100 | #261 | Tragic 52.4% |
| Immigrants | Northern Africa | 0.4 /100 | #262 | Tragic 52.3% |
| Immigrants | Southern Europe | 0.4 /100 | #263 | Tragic 52.3% |
| Immigrants | Latvia | 0.4 /100 | #264 | Tragic 52.2% |
| Immigrants | Congo | 0.3 /100 | #265 | Tragic 52.1% |
| Immigrants | France | 0.2 /100 | #266 | Tragic 52.0% |
| Immigrants | Colombia | 0.2 /100 | #267 | Tragic 52.0% |
| Pima | 0.2 /100 | #268 | Tragic 52.0% |
| Hondurans | 0.2 /100 | #269 | Tragic 52.0% |
| Immigrants | Ireland | 0.2 /100 | #270 | Tragic 52.0% |
| South Americans | 0.2 /100 | #271 | Tragic 51.9% |
Demographics Similar to Croatians by 2 or more Vehicles in Household
In terms of 2 or more vehicles in household, the demographic groups most similar to Croatians are Immigrants from Central America (58.6%, a difference of 0.010%), Laotian (58.6%, a difference of 0.020%), Canadian (58.6%, a difference of 0.030%), Portuguese (58.6%, a difference of 0.060%), and Pennsylvania German (58.5%, a difference of 0.15%).
| Demographics | Rating | Rank | 2 or more Vehicles in Household |
| Spanish Americans | 99.8 /100 | #59 | Exceptional 58.9% |
| French Canadians | 99.8 /100 | #60 | Exceptional 58.9% |
| Osage | 99.8 /100 | #61 | Exceptional 58.8% |
| Immigrants | Nonimmigrants | 99.8 /100 | #62 | Exceptional 58.8% |
| Mexican American Indians | 99.8 /100 | #63 | Exceptional 58.7% |
| Portuguese | 99.7 /100 | #64 | Exceptional 58.6% |
| Immigrants | Central America | 99.7 /100 | #65 | Exceptional 58.6% |
| Croatians | 99.7 /100 | #66 | Exceptional 58.6% |
| Laotians | 99.7 /100 | #67 | Exceptional 58.6% |
| Canadians | 99.7 /100 | #68 | Exceptional 58.6% |
| Pennsylvania Germans | 99.7 /100 | #69 | Exceptional 58.5% |
| Italians | 99.6 /100 | #70 | Exceptional 58.4% |
| Bangladeshis | 99.6 /100 | #71 | Exceptional 58.4% |
| Austrians | 99.6 /100 | #72 | Exceptional 58.4% |
| Bolivians | 99.6 /100 | #73 | Exceptional 58.3% |