Immigrants from Latvia vs Immigrants from El Salvador 2 or more Vehicles in Household
COMPARE
Immigrants from Latvia
Immigrants from El Salvador
2 or more Vehicles in Household
2 or more Vehicles in Household Comparison
Immigrants from Latvia
Immigrants from El Salvador
52.2%
2 OR MORE VEHICLES IN HOUSEHOLD
0.4/ 100
METRIC RATING
264th/ 347
METRIC RANK
55.6%
2 OR MORE VEHICLES IN HOUSEHOLD
59.4/ 100
METRIC RATING
165th/ 347
METRIC RANK
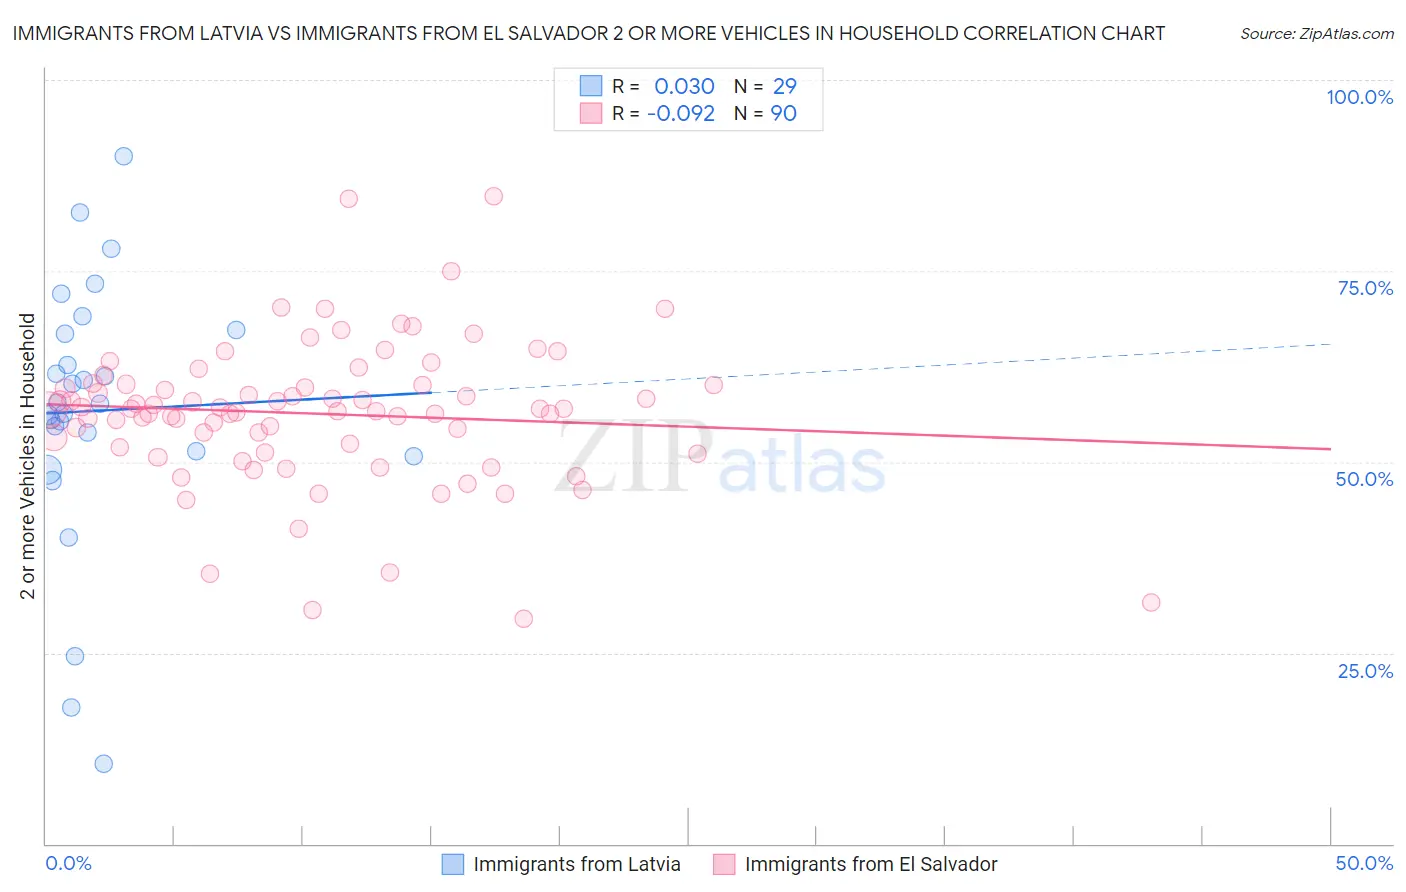
Immigrants from Latvia vs Immigrants from El Salvador 2 or more Vehicles in Household Correlation Chart
The statistical analysis conducted on geographies consisting of 113,732,153 people shows no correlation between the proportion of Immigrants from Latvia and percentage of households with 2 or more vehicles available in the United States with a correlation coefficient (R) of 0.030 and weighted average of 52.2%. Similarly, the statistical analysis conducted on geographies consisting of 357,715,134 people shows a slight negative correlation between the proportion of Immigrants from El Salvador and percentage of households with 2 or more vehicles available in the United States with a correlation coefficient (R) of -0.092 and weighted average of 55.6%, a difference of 6.3%.
2 or more Vehicles in Household Correlation Summary
| Measurement | Immigrants from Latvia | Immigrants from El Salvador |
| Minimum | 10.4% | 29.5% |
| Maximum | 89.9% | 84.8% |
| Range | 79.5% | 55.4% |
| Mean | 56.7% | 56.3% |
| Median | 57.6% | 56.8% |
| Interquartile 25% (IQ1) | 51.0% | 51.9% |
| Interquartile 75% (IQ3) | 67.1% | 60.1% |
| Interquartile Range (IQR) | 16.0% | 8.1% |
| Standard Deviation (Sample) | 17.3% | 9.5% |
| Standard Deviation (Population) | 17.0% | 9.4% |
Similar Demographics by 2 or more Vehicles in Household
Demographics Similar to Immigrants from Latvia by 2 or more Vehicles in Household
In terms of 2 or more vehicles in household, the demographic groups most similar to Immigrants from Latvia are Immigrants from Southern Europe (52.3%, a difference of 0.040%), Immigrants from Northern Africa (52.3%, a difference of 0.17%), Immigrants from Congo (52.1%, a difference of 0.24%), Immigrants from Australia (52.4%, a difference of 0.37%), and Immigrants from France (52.0%, a difference of 0.39%).
| Demographics | Rating | Rank | 2 or more Vehicles in Household |
| Immigrants | Hong Kong | 0.6 /100 | #257 | Tragic 52.6% |
| Central American Indians | 0.6 /100 | #258 | Tragic 52.5% |
| Alsatians | 0.6 /100 | #259 | Tragic 52.5% |
| Immigrants | Bahamas | 0.5 /100 | #260 | Tragic 52.5% |
| Immigrants | Australia | 0.5 /100 | #261 | Tragic 52.4% |
| Immigrants | Northern Africa | 0.4 /100 | #262 | Tragic 52.3% |
| Immigrants | Southern Europe | 0.4 /100 | #263 | Tragic 52.3% |
| Immigrants | Latvia | 0.4 /100 | #264 | Tragic 52.2% |
| Immigrants | Congo | 0.3 /100 | #265 | Tragic 52.1% |
| Immigrants | France | 0.2 /100 | #266 | Tragic 52.0% |
| Immigrants | Colombia | 0.2 /100 | #267 | Tragic 52.0% |
| Pima | 0.2 /100 | #268 | Tragic 52.0% |
| Hondurans | 0.2 /100 | #269 | Tragic 52.0% |
| Immigrants | Ireland | 0.2 /100 | #270 | Tragic 52.0% |
| South Americans | 0.2 /100 | #271 | Tragic 51.9% |
Demographics Similar to Immigrants from El Salvador by 2 or more Vehicles in Household
In terms of 2 or more vehicles in household, the demographic groups most similar to Immigrants from El Salvador are Dutch West Indian (55.6%, a difference of 0.020%), Immigrants from Zimbabwe (55.6%, a difference of 0.030%), Immigrants from Sri Lanka (55.5%, a difference of 0.040%), Kenyan (55.5%, a difference of 0.050%), and German Russian (55.6%, a difference of 0.060%).
| Demographics | Rating | Rank | 2 or more Vehicles in Household |
| Tlingit-Haida | 68.5 /100 | #158 | Good 55.8% |
| Paiute | 68.0 /100 | #159 | Good 55.8% |
| Crow | 67.0 /100 | #160 | Good 55.7% |
| Colville | 61.1 /100 | #161 | Good 55.6% |
| German Russians | 60.9 /100 | #162 | Good 55.6% |
| Immigrants | Zimbabwe | 60.2 /100 | #163 | Good 55.6% |
| Dutch West Indians | 59.8 /100 | #164 | Average 55.6% |
| Immigrants | El Salvador | 59.4 /100 | #165 | Average 55.6% |
| Immigrants | Sri Lanka | 58.3 /100 | #166 | Average 55.5% |
| Kenyans | 58.1 /100 | #167 | Average 55.5% |
| French American Indians | 56.7 /100 | #168 | Average 55.5% |
| Immigrants | Austria | 56.3 /100 | #169 | Average 55.5% |
| Romanians | 55.8 /100 | #170 | Average 55.5% |
| Immigrants | Costa Rica | 54.4 /100 | #171 | Average 55.4% |
| Immigrants | Nicaragua | 51.6 /100 | #172 | Average 55.4% |