Immigrants from Latvia vs Yugoslavian 2 or more Vehicles in Household
COMPARE
Immigrants from Latvia
Yugoslavian
2 or more Vehicles in Household
2 or more Vehicles in Household Comparison
Immigrants from Latvia
Yugoslavians
52.2%
2 OR MORE VEHICLES IN HOUSEHOLD
0.4/ 100
METRIC RATING
264th/ 347
METRIC RANK
56.6%
2 OR MORE VEHICLES IN HOUSEHOLD
90.0/ 100
METRIC RATING
130th/ 347
METRIC RANK
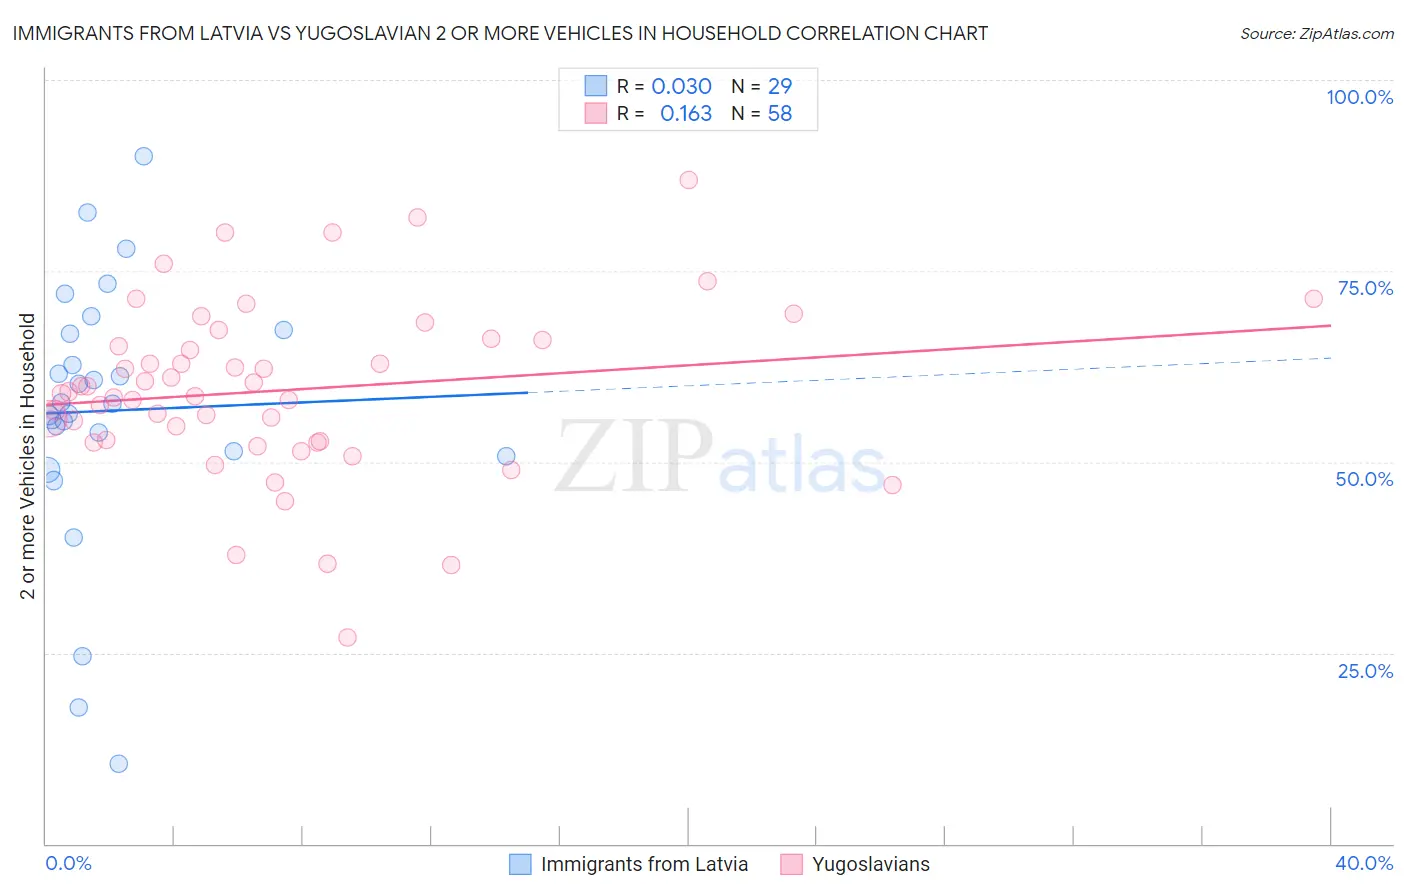
Immigrants from Latvia vs Yugoslavian 2 or more Vehicles in Household Correlation Chart
The statistical analysis conducted on geographies consisting of 113,732,153 people shows no correlation between the proportion of Immigrants from Latvia and percentage of households with 2 or more vehicles available in the United States with a correlation coefficient (R) of 0.030 and weighted average of 52.2%. Similarly, the statistical analysis conducted on geographies consisting of 285,645,335 people shows a poor positive correlation between the proportion of Yugoslavians and percentage of households with 2 or more vehicles available in the United States with a correlation coefficient (R) of 0.163 and weighted average of 56.6%, a difference of 8.3%.
2 or more Vehicles in Household Correlation Summary
| Measurement | Immigrants from Latvia | Yugoslavian |
| Minimum | 10.4% | 27.0% |
| Maximum | 89.9% | 87.0% |
| Range | 79.5% | 59.9% |
| Mean | 56.7% | 59.4% |
| Median | 57.6% | 59.1% |
| Interquartile 25% (IQ1) | 51.0% | 52.7% |
| Interquartile 75% (IQ3) | 67.1% | 66.0% |
| Interquartile Range (IQR) | 16.0% | 13.3% |
| Standard Deviation (Sample) | 17.3% | 11.3% |
| Standard Deviation (Population) | 17.0% | 11.2% |
Similar Demographics by 2 or more Vehicles in Household
Demographics Similar to Immigrants from Latvia by 2 or more Vehicles in Household
In terms of 2 or more vehicles in household, the demographic groups most similar to Immigrants from Latvia are Immigrants from Southern Europe (52.3%, a difference of 0.040%), Immigrants from Northern Africa (52.3%, a difference of 0.17%), Immigrants from Congo (52.1%, a difference of 0.24%), Immigrants from Australia (52.4%, a difference of 0.37%), and Immigrants from France (52.0%, a difference of 0.39%).
| Demographics | Rating | Rank | 2 or more Vehicles in Household |
| Immigrants | Hong Kong | 0.6 /100 | #257 | Tragic 52.6% |
| Central American Indians | 0.6 /100 | #258 | Tragic 52.5% |
| Alsatians | 0.6 /100 | #259 | Tragic 52.5% |
| Immigrants | Bahamas | 0.5 /100 | #260 | Tragic 52.5% |
| Immigrants | Australia | 0.5 /100 | #261 | Tragic 52.4% |
| Immigrants | Northern Africa | 0.4 /100 | #262 | Tragic 52.3% |
| Immigrants | Southern Europe | 0.4 /100 | #263 | Tragic 52.3% |
| Immigrants | Latvia | 0.4 /100 | #264 | Tragic 52.2% |
| Immigrants | Congo | 0.3 /100 | #265 | Tragic 52.1% |
| Immigrants | France | 0.2 /100 | #266 | Tragic 52.0% |
| Immigrants | Colombia | 0.2 /100 | #267 | Tragic 52.0% |
| Pima | 0.2 /100 | #268 | Tragic 52.0% |
| Hondurans | 0.2 /100 | #269 | Tragic 52.0% |
| Immigrants | Ireland | 0.2 /100 | #270 | Tragic 52.0% |
| South Americans | 0.2 /100 | #271 | Tragic 51.9% |
Demographics Similar to Yugoslavians by 2 or more Vehicles in Household
In terms of 2 or more vehicles in household, the demographic groups most similar to Yugoslavians are Bulgarian (56.5%, a difference of 0.030%), Ute (56.6%, a difference of 0.040%), Immigrants from South Central Asia (56.6%, a difference of 0.060%), Immigrants from Thailand (56.6%, a difference of 0.070%), and Hungarian (56.5%, a difference of 0.090%).
| Demographics | Rating | Rank | 2 or more Vehicles in Household |
| Australians | 91.8 /100 | #123 | Exceptional 56.7% |
| New Zealanders | 91.8 /100 | #124 | Exceptional 56.7% |
| Tsimshian | 91.6 /100 | #125 | Exceptional 56.7% |
| Estonians | 90.9 /100 | #126 | Exceptional 56.6% |
| Immigrants | Thailand | 90.7 /100 | #127 | Exceptional 56.6% |
| Immigrants | South Central Asia | 90.5 /100 | #128 | Exceptional 56.6% |
| Ute | 90.4 /100 | #129 | Exceptional 56.6% |
| Yugoslavians | 90.0 /100 | #130 | Exceptional 56.6% |
| Bulgarians | 89.7 /100 | #131 | Excellent 56.5% |
| Hungarians | 89.1 /100 | #132 | Excellent 56.5% |
| Comanche | 88.4 /100 | #133 | Excellent 56.5% |
| Immigrants | Azores | 86.6 /100 | #134 | Excellent 56.4% |
| Blackfeet | 86.5 /100 | #135 | Excellent 56.4% |
| Immigrants | Asia | 86.0 /100 | #136 | Excellent 56.3% |
| Cubans | 84.8 /100 | #137 | Excellent 56.3% |