Immigrants from Latvia vs Armenian 2 or more Vehicles in Household
COMPARE
Immigrants from Latvia
Armenian
2 or more Vehicles in Household
2 or more Vehicles in Household Comparison
Immigrants from Latvia
Armenians
52.2%
2 OR MORE VEHICLES IN HOUSEHOLD
0.4/ 100
METRIC RATING
264th/ 347
METRIC RANK
56.3%
2 OR MORE VEHICLES IN HOUSEHOLD
84.3/ 100
METRIC RATING
139th/ 347
METRIC RANK
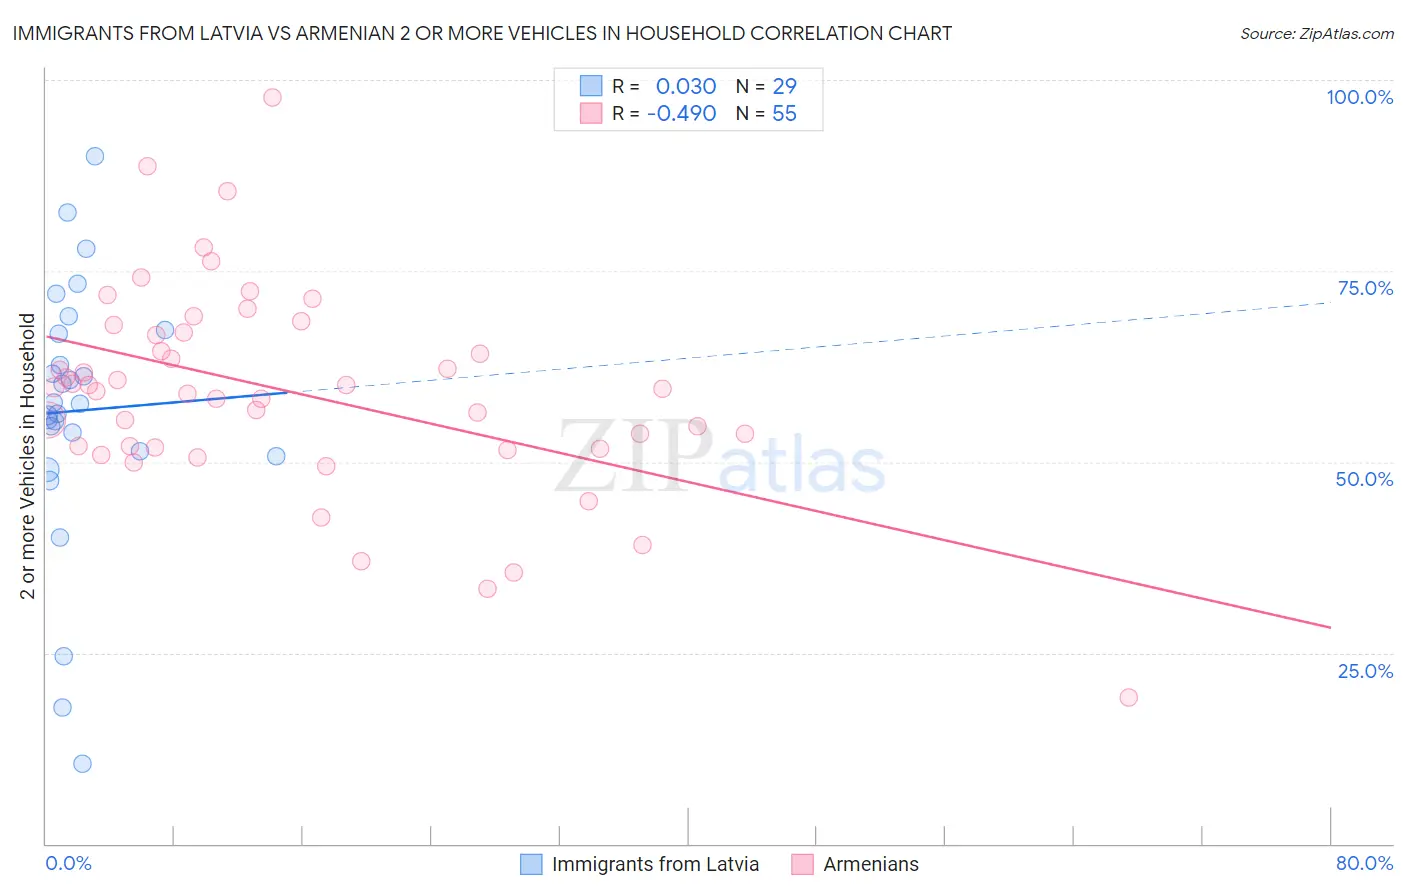
Immigrants from Latvia vs Armenian 2 or more Vehicles in Household Correlation Chart
The statistical analysis conducted on geographies consisting of 113,732,153 people shows no correlation between the proportion of Immigrants from Latvia and percentage of households with 2 or more vehicles available in the United States with a correlation coefficient (R) of 0.030 and weighted average of 52.2%. Similarly, the statistical analysis conducted on geographies consisting of 310,821,659 people shows a moderate negative correlation between the proportion of Armenians and percentage of households with 2 or more vehicles available in the United States with a correlation coefficient (R) of -0.490 and weighted average of 56.3%, a difference of 7.7%.
2 or more Vehicles in Household Correlation Summary
| Measurement | Immigrants from Latvia | Armenian |
| Minimum | 10.4% | 19.2% |
| Maximum | 89.9% | 97.7% |
| Range | 79.5% | 78.5% |
| Mean | 56.7% | 59.2% |
| Median | 57.6% | 59.5% |
| Interquartile 25% (IQ1) | 51.0% | 51.9% |
| Interquartile 75% (IQ3) | 67.1% | 67.0% |
| Interquartile Range (IQR) | 16.0% | 15.1% |
| Standard Deviation (Sample) | 17.3% | 13.6% |
| Standard Deviation (Population) | 17.0% | 13.4% |
Similar Demographics by 2 or more Vehicles in Household
Demographics Similar to Immigrants from Latvia by 2 or more Vehicles in Household
In terms of 2 or more vehicles in household, the demographic groups most similar to Immigrants from Latvia are Immigrants from Southern Europe (52.3%, a difference of 0.040%), Immigrants from Northern Africa (52.3%, a difference of 0.17%), Immigrants from Congo (52.1%, a difference of 0.24%), Immigrants from Australia (52.4%, a difference of 0.37%), and Immigrants from France (52.0%, a difference of 0.39%).
| Demographics | Rating | Rank | 2 or more Vehicles in Household |
| Immigrants | Hong Kong | 0.6 /100 | #257 | Tragic 52.6% |
| Central American Indians | 0.6 /100 | #258 | Tragic 52.5% |
| Alsatians | 0.6 /100 | #259 | Tragic 52.5% |
| Immigrants | Bahamas | 0.5 /100 | #260 | Tragic 52.5% |
| Immigrants | Australia | 0.5 /100 | #261 | Tragic 52.4% |
| Immigrants | Northern Africa | 0.4 /100 | #262 | Tragic 52.3% |
| Immigrants | Southern Europe | 0.4 /100 | #263 | Tragic 52.3% |
| Immigrants | Latvia | 0.4 /100 | #264 | Tragic 52.2% |
| Immigrants | Congo | 0.3 /100 | #265 | Tragic 52.1% |
| Immigrants | France | 0.2 /100 | #266 | Tragic 52.0% |
| Immigrants | Colombia | 0.2 /100 | #267 | Tragic 52.0% |
| Pima | 0.2 /100 | #268 | Tragic 52.0% |
| Hondurans | 0.2 /100 | #269 | Tragic 52.0% |
| Immigrants | Ireland | 0.2 /100 | #270 | Tragic 52.0% |
| South Americans | 0.2 /100 | #271 | Tragic 51.9% |
Demographics Similar to Armenians by 2 or more Vehicles in Household
In terms of 2 or more vehicles in household, the demographic groups most similar to Armenians are Salvadoran (56.3%, a difference of 0.030%), Cuban (56.3%, a difference of 0.040%), Latvian (56.2%, a difference of 0.050%), Immigrants from Cambodia (56.2%, a difference of 0.050%), and South African (56.2%, a difference of 0.090%).
| Demographics | Rating | Rank | 2 or more Vehicles in Household |
| Hungarians | 89.1 /100 | #132 | Excellent 56.5% |
| Comanche | 88.4 /100 | #133 | Excellent 56.5% |
| Immigrants | Azores | 86.6 /100 | #134 | Excellent 56.4% |
| Blackfeet | 86.5 /100 | #135 | Excellent 56.4% |
| Immigrants | Asia | 86.0 /100 | #136 | Excellent 56.3% |
| Cubans | 84.8 /100 | #137 | Excellent 56.3% |
| Salvadorans | 84.7 /100 | #138 | Excellent 56.3% |
| Armenians | 84.3 /100 | #139 | Excellent 56.3% |
| Latvians | 83.6 /100 | #140 | Excellent 56.2% |
| Immigrants | Cambodia | 83.6 /100 | #141 | Excellent 56.2% |
| South Africans | 83.1 /100 | #142 | Excellent 56.2% |
| Seminole | 81.7 /100 | #143 | Excellent 56.2% |
| Immigrants | Syria | 81.4 /100 | #144 | Excellent 56.2% |
| Syrians | 81.2 /100 | #145 | Excellent 56.2% |
| Venezuelans | 80.7 /100 | #146 | Excellent 56.1% |