Immigrants from Latvia vs Croatian 3 or more Vehicles in Household
COMPARE
Immigrants from Latvia
Croatian
3 or more Vehicles in Household
3 or more Vehicles in Household Comparison
Immigrants from Latvia
Croatians
17.4%
3 OR MORE VEHICLES IN HOUSEHOLD
0.3/ 100
METRIC RATING
281st/ 347
METRIC RANK
20.6%
3 OR MORE VEHICLES IN HOUSEHOLD
94.9/ 100
METRIC RATING
117th/ 347
METRIC RANK
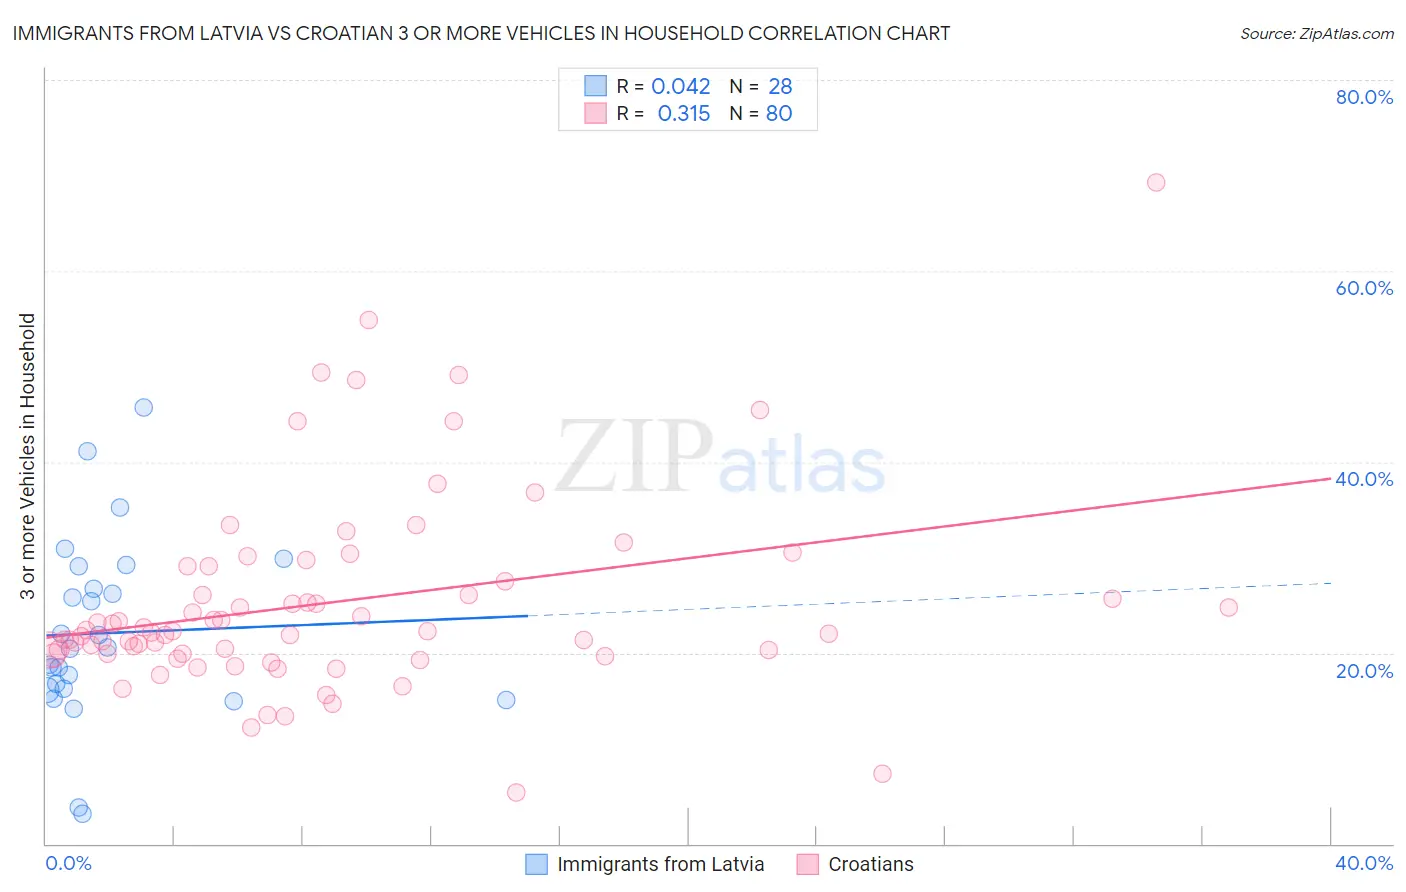
Immigrants from Latvia vs Croatian 3 or more Vehicles in Household Correlation Chart
The statistical analysis conducted on geographies consisting of 113,711,739 people shows no correlation between the proportion of Immigrants from Latvia and percentage of households with 3 or more vehicles available in the United States with a correlation coefficient (R) of 0.042 and weighted average of 17.4%. Similarly, the statistical analysis conducted on geographies consisting of 375,444,957 people shows a mild positive correlation between the proportion of Croatians and percentage of households with 3 or more vehicles available in the United States with a correlation coefficient (R) of 0.315 and weighted average of 20.6%, a difference of 18.3%.
3 or more Vehicles in Household Correlation Summary
| Measurement | Immigrants from Latvia | Croatian |
| Minimum | 3.1% | 5.4% |
| Maximum | 45.7% | 69.3% |
| Range | 42.6% | 63.8% |
| Mean | 22.1% | 25.2% |
| Median | 20.5% | 22.2% |
| Interquartile 25% (IQ1) | 16.1% | 19.9% |
| Interquartile 75% (IQ3) | 27.9% | 28.3% |
| Interquartile Range (IQR) | 11.7% | 8.4% |
| Standard Deviation (Sample) | 9.5% | 10.5% |
| Standard Deviation (Population) | 9.4% | 10.4% |
Similar Demographics by 3 or more Vehicles in Household
Demographics Similar to Immigrants from Latvia by 3 or more Vehicles in Household
In terms of 3 or more vehicles in household, the demographic groups most similar to Immigrants from Latvia are Immigrants from Eastern Europe (17.4%, a difference of 0.040%), Immigrants from Kazakhstan (17.4%, a difference of 0.080%), Immigrants from Bahamas (17.4%, a difference of 0.10%), Brazilian (17.4%, a difference of 0.19%), and Immigrants from Ireland (17.3%, a difference of 0.29%).
| Demographics | Rating | Rank | 3 or more Vehicles in Household |
| Immigrants | Bosnia and Herzegovina | 0.5 /100 | #274 | Tragic 17.5% |
| Immigrants | Ukraine | 0.4 /100 | #275 | Tragic 17.5% |
| Okinawans | 0.4 /100 | #276 | Tragic 17.4% |
| Brazilians | 0.4 /100 | #277 | Tragic 17.4% |
| Immigrants | Bahamas | 0.3 /100 | #278 | Tragic 17.4% |
| Immigrants | Kazakhstan | 0.3 /100 | #279 | Tragic 17.4% |
| Immigrants | Eastern Europe | 0.3 /100 | #280 | Tragic 17.4% |
| Immigrants | Latvia | 0.3 /100 | #281 | Tragic 17.4% |
| Immigrants | Ireland | 0.3 /100 | #282 | Tragic 17.3% |
| Blacks/African Americans | 0.3 /100 | #283 | Tragic 17.3% |
| Immigrants | Colombia | 0.3 /100 | #284 | Tragic 17.3% |
| Immigrants | Croatia | 0.2 /100 | #285 | Tragic 17.2% |
| Menominee | 0.2 /100 | #286 | Tragic 17.2% |
| Immigrants | Brazil | 0.2 /100 | #287 | Tragic 17.1% |
| Immigrants | Uruguay | 0.2 /100 | #288 | Tragic 17.1% |
Demographics Similar to Croatians by 3 or more Vehicles in Household
In terms of 3 or more vehicles in household, the demographic groups most similar to Croatians are Italian (20.6%, a difference of 0.020%), French Canadian (20.6%, a difference of 0.050%), Costa Rican (20.6%, a difference of 0.11%), Immigrants from Latin America (20.5%, a difference of 0.15%), and Maltese (20.5%, a difference of 0.35%).
| Demographics | Rating | Rank | 3 or more Vehicles in Household |
| Asians | 96.8 /100 | #110 | Exceptional 20.8% |
| Immigrants | Micronesia | 96.7 /100 | #111 | Exceptional 20.7% |
| Nicaraguans | 96.2 /100 | #112 | Exceptional 20.7% |
| Immigrants | England | 96.2 /100 | #113 | Exceptional 20.7% |
| Burmese | 95.8 /100 | #114 | Exceptional 20.6% |
| French Canadians | 95.0 /100 | #115 | Exceptional 20.6% |
| Italians | 94.9 /100 | #116 | Exceptional 20.6% |
| Croatians | 94.9 /100 | #117 | Exceptional 20.6% |
| Costa Ricans | 94.6 /100 | #118 | Exceptional 20.6% |
| Immigrants | Latin America | 94.5 /100 | #119 | Exceptional 20.5% |
| Maltese | 93.9 /100 | #120 | Exceptional 20.5% |
| Immigrants | Thailand | 93.8 /100 | #121 | Exceptional 20.5% |
| German Russians | 93.7 /100 | #122 | Exceptional 20.5% |
| Immigrants | Korea | 93.7 /100 | #123 | Exceptional 20.5% |
| Central Americans | 93.1 /100 | #124 | Exceptional 20.5% |