Immigrants from Latvia vs Croatian Wage/Income Gap
COMPARE
Immigrants from Latvia
Croatian
Wage/Income Gap
Wage/Income Gap Comparison
Immigrants from Latvia
Croatians
26.7%
WAGE/INCOME GAP
8.9/ 100
METRIC RATING
220th/ 347
METRIC RANK
29.0%
WAGE/INCOME GAP
0.0/ 100
METRIC RATING
324th/ 347
METRIC RANK
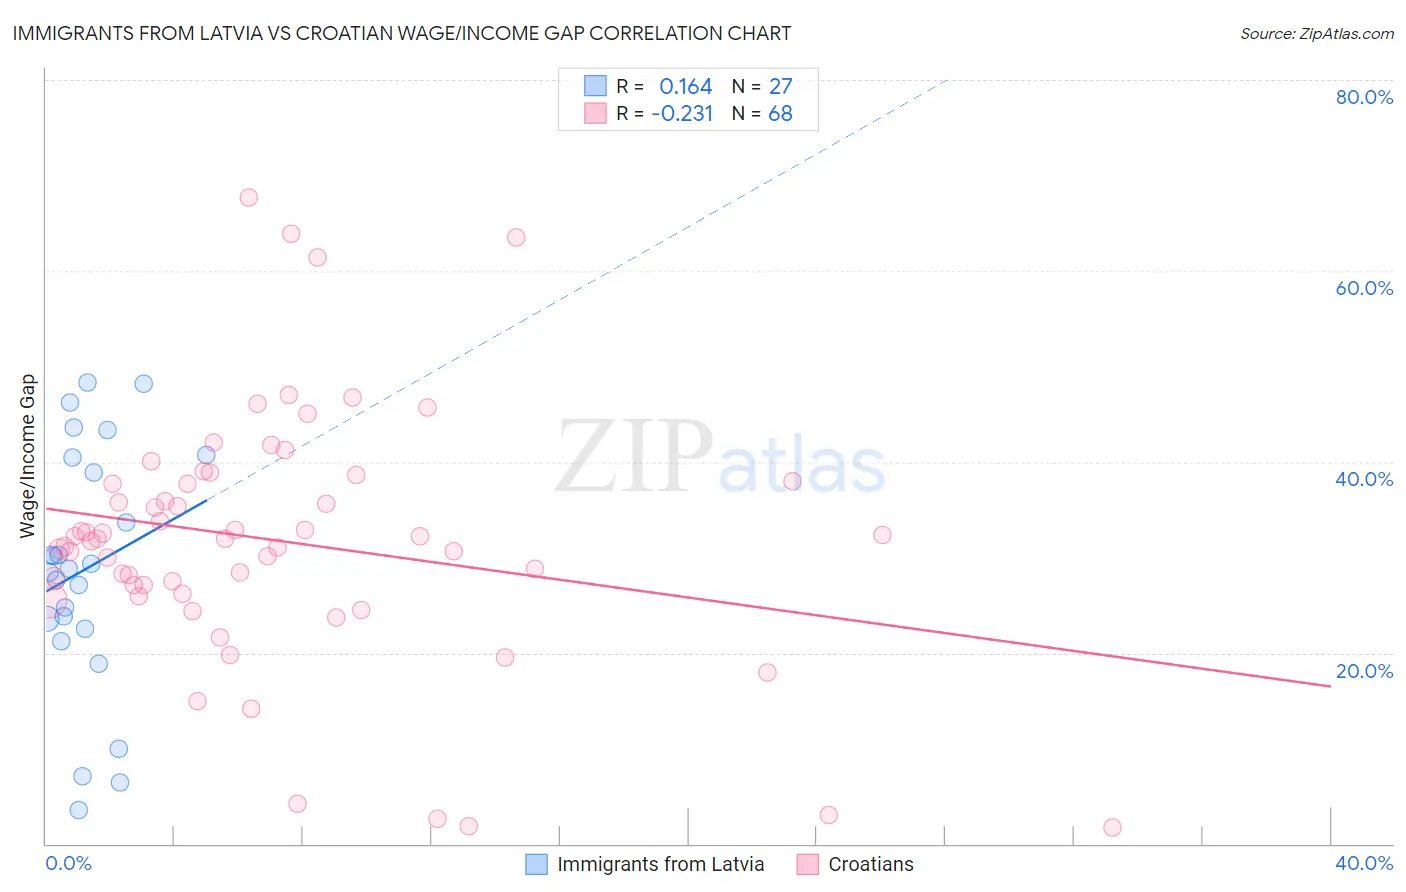
Immigrants from Latvia vs Croatian Wage/Income Gap Correlation Chart
The statistical analysis conducted on geographies consisting of 113,720,883 people shows a poor positive correlation between the proportion of Immigrants from Latvia and wage/income gap percentage in the United States with a correlation coefficient (R) of 0.164 and weighted average of 26.7%. Similarly, the statistical analysis conducted on geographies consisting of 375,417,057 people shows a weak negative correlation between the proportion of Croatians and wage/income gap percentage in the United States with a correlation coefficient (R) of -0.231 and weighted average of 29.0%, a difference of 8.4%.
Wage/Income Gap Correlation Summary
| Measurement | Immigrants from Latvia | Croatian |
| Minimum | 3.5% | 1.8% |
| Maximum | 48.4% | 67.7% |
| Range | 44.8% | 65.9% |
| Mean | 28.8% | 31.7% |
| Median | 28.9% | 31.9% |
| Interquartile 25% (IQ1) | 22.5% | 26.6% |
| Interquartile 75% (IQ3) | 40.4% | 37.8% |
| Interquartile Range (IQR) | 18.0% | 11.2% |
| Standard Deviation (Sample) | 12.6% | 13.2% |
| Standard Deviation (Population) | 12.4% | 13.2% |
Similar Demographics by Wage/Income Gap
Demographics Similar to Immigrants from Latvia by Wage/Income Gap
In terms of wage/income gap, the demographic groups most similar to Immigrants from Latvia are Immigrants from Poland (26.7%, a difference of 0.010%), Immigrants from Saudi Arabia (26.7%, a difference of 0.040%), Brazilian (26.7%, a difference of 0.070%), Immigrants from Spain (26.8%, a difference of 0.070%), and Bolivian (26.8%, a difference of 0.11%).
| Demographics | Rating | Rank | Wage/Income Gap |
| Immigrants | Iraq | 10.3 /100 | #213 | Poor 26.7% |
| Immigrants | China | 10.3 /100 | #214 | Poor 26.7% |
| Yugoslavians | 9.7 /100 | #215 | Tragic 26.7% |
| Immigrants | Portugal | 9.5 /100 | #216 | Tragic 26.7% |
| Brazilians | 9.2 /100 | #217 | Tragic 26.7% |
| Immigrants | Saudi Arabia | 9.1 /100 | #218 | Tragic 26.7% |
| Immigrants | Poland | 8.9 /100 | #219 | Tragic 26.7% |
| Immigrants | Latvia | 8.9 /100 | #220 | Tragic 26.7% |
| Immigrants | Spain | 8.5 /100 | #221 | Tragic 26.8% |
| Bolivians | 8.3 /100 | #222 | Tragic 26.8% |
| Jordanians | 8.0 /100 | #223 | Tragic 26.8% |
| Immigrants | Argentina | 7.2 /100 | #224 | Tragic 26.8% |
| Immigrants | Ireland | 6.5 /100 | #225 | Tragic 26.9% |
| Asians | 5.9 /100 | #226 | Tragic 26.9% |
| Spaniards | 5.6 /100 | #227 | Tragic 27.0% |
Demographics Similar to Croatians by Wage/Income Gap
In terms of wage/income gap, the demographic groups most similar to Croatians are Norwegian (29.0%, a difference of 0.12%), Hungarian (29.0%, a difference of 0.13%), Immigrants from Belgium (29.0%, a difference of 0.20%), Immigrants from Singapore (28.9%, a difference of 0.23%), and Welsh (28.9%, a difference of 0.25%).
| Demographics | Rating | Rank | Wage/Income Gap |
| Belgians | 0.1 /100 | #317 | Tragic 28.8% |
| Basques | 0.1 /100 | #318 | Tragic 28.8% |
| Slovaks | 0.1 /100 | #319 | Tragic 28.9% |
| British | 0.1 /100 | #320 | Tragic 28.9% |
| Welsh | 0.1 /100 | #321 | Tragic 28.9% |
| Immigrants | Singapore | 0.1 /100 | #322 | Tragic 28.9% |
| Norwegians | 0.1 /100 | #323 | Tragic 29.0% |
| Croatians | 0.0 /100 | #324 | Tragic 29.0% |
| Hungarians | 0.0 /100 | #325 | Tragic 29.0% |
| Immigrants | Belgium | 0.0 /100 | #326 | Tragic 29.0% |
| Immigrants | Iran | 0.0 /100 | #327 | Tragic 29.1% |
| Scandinavians | 0.0 /100 | #328 | Tragic 29.1% |
| Scottish | 0.0 /100 | #329 | Tragic 29.1% |
| Germans | 0.0 /100 | #330 | Tragic 29.2% |
| Czechs | 0.0 /100 | #331 | Tragic 29.2% |