Inupiat vs Croatian 2 or more Vehicles in Household
COMPARE
Inupiat
Croatian
2 or more Vehicles in Household
2 or more Vehicles in Household Comparison
Inupiat
Croatians
42.6%
2 OR MORE VEHICLES IN HOUSEHOLD
0.0/ 100
METRIC RATING
328th/ 347
METRIC RANK
58.6%
2 OR MORE VEHICLES IN HOUSEHOLD
99.7/ 100
METRIC RATING
66th/ 347
METRIC RANK
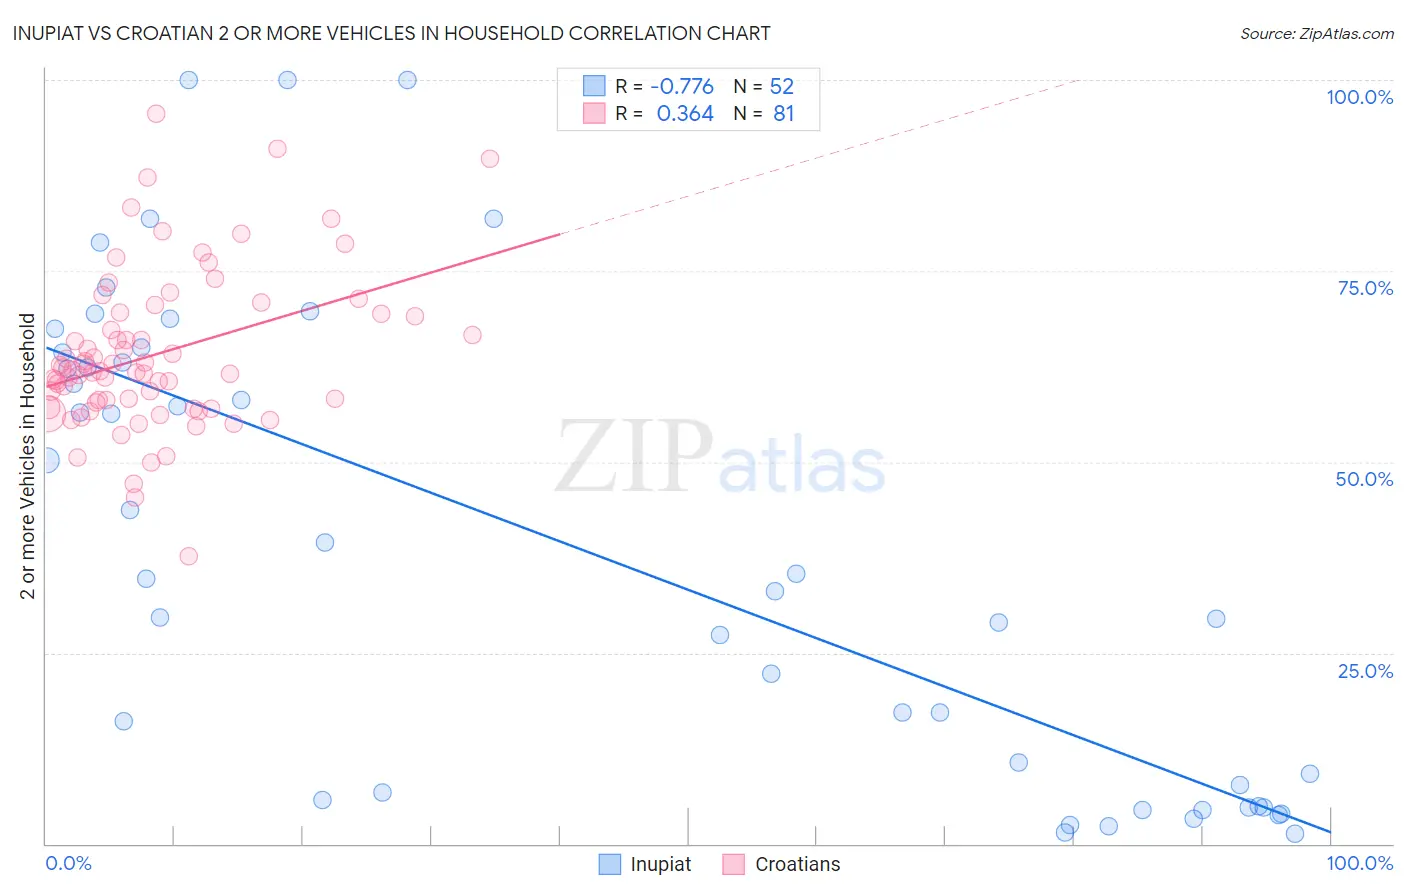
Inupiat vs Croatian 2 or more Vehicles in Household Correlation Chart
The statistical analysis conducted on geographies consisting of 96,302,889 people shows a strong negative correlation between the proportion of Inupiat and percentage of households with 2 or more vehicles available in the United States with a correlation coefficient (R) of -0.776 and weighted average of 42.6%. Similarly, the statistical analysis conducted on geographies consisting of 375,571,989 people shows a mild positive correlation between the proportion of Croatians and percentage of households with 2 or more vehicles available in the United States with a correlation coefficient (R) of 0.364 and weighted average of 58.6%, a difference of 37.4%.
2 or more Vehicles in Household Correlation Summary
| Measurement | Inupiat | Croatian |
| Minimum | 1.4% | 37.6% |
| Maximum | 100.0% | 95.6% |
| Range | 98.6% | 57.9% |
| Mean | 38.5% | 64.1% |
| Median | 33.9% | 61.9% |
| Interquartile 25% (IQ1) | 6.2% | 57.4% |
| Interquartile 75% (IQ3) | 63.7% | 69.4% |
| Interquartile Range (IQR) | 57.5% | 12.0% |
| Standard Deviation (Sample) | 30.7% | 10.4% |
| Standard Deviation (Population) | 30.4% | 10.3% |
Similar Demographics by 2 or more Vehicles in Household
Demographics Similar to Inupiat by 2 or more Vehicles in Household
In terms of 2 or more vehicles in household, the demographic groups most similar to Inupiat are Immigrants from Yemen (42.8%, a difference of 0.50%), Immigrants from Senegal (43.0%, a difference of 0.91%), Immigrants from West Indies (43.1%, a difference of 1.1%), Ecuadorian (42.0%, a difference of 1.6%), and Immigrants from Cabo Verde (43.3%, a difference of 1.6%).
| Demographics | Rating | Rank | 2 or more Vehicles in Household |
| Immigrants | Jamaica | 0.0 /100 | #321 | Tragic 44.5% |
| Senegalese | 0.0 /100 | #322 | Tragic 44.2% |
| Immigrants | Caribbean | 0.0 /100 | #323 | Tragic 44.2% |
| Immigrants | Cabo Verde | 0.0 /100 | #324 | Tragic 43.3% |
| Immigrants | West Indies | 0.0 /100 | #325 | Tragic 43.1% |
| Immigrants | Senegal | 0.0 /100 | #326 | Tragic 43.0% |
| Immigrants | Yemen | 0.0 /100 | #327 | Tragic 42.8% |
| Inupiat | 0.0 /100 | #328 | Tragic 42.6% |
| Ecuadorians | 0.0 /100 | #329 | Tragic 42.0% |
| Immigrants | Dominica | 0.0 /100 | #330 | Tragic 41.6% |
| West Indians | 0.0 /100 | #331 | Tragic 41.3% |
| Trinidadians and Tobagonians | 0.0 /100 | #332 | Tragic 40.9% |
| Immigrants | Ecuador | 0.0 /100 | #333 | Tragic 40.5% |
| Immigrants | Trinidad and Tobago | 0.0 /100 | #334 | Tragic 40.3% |
| Immigrants | Bangladesh | 0.0 /100 | #335 | Tragic 38.8% |
Demographics Similar to Croatians by 2 or more Vehicles in Household
In terms of 2 or more vehicles in household, the demographic groups most similar to Croatians are Immigrants from Central America (58.6%, a difference of 0.010%), Laotian (58.6%, a difference of 0.020%), Canadian (58.6%, a difference of 0.030%), Portuguese (58.6%, a difference of 0.060%), and Pennsylvania German (58.5%, a difference of 0.15%).
| Demographics | Rating | Rank | 2 or more Vehicles in Household |
| Spanish Americans | 99.8 /100 | #59 | Exceptional 58.9% |
| French Canadians | 99.8 /100 | #60 | Exceptional 58.9% |
| Osage | 99.8 /100 | #61 | Exceptional 58.8% |
| Immigrants | Nonimmigrants | 99.8 /100 | #62 | Exceptional 58.8% |
| Mexican American Indians | 99.8 /100 | #63 | Exceptional 58.7% |
| Portuguese | 99.7 /100 | #64 | Exceptional 58.6% |
| Immigrants | Central America | 99.7 /100 | #65 | Exceptional 58.6% |
| Croatians | 99.7 /100 | #66 | Exceptional 58.6% |
| Laotians | 99.7 /100 | #67 | Exceptional 58.6% |
| Canadians | 99.7 /100 | #68 | Exceptional 58.6% |
| Pennsylvania Germans | 99.7 /100 | #69 | Exceptional 58.5% |
| Italians | 99.6 /100 | #70 | Exceptional 58.4% |
| Bangladeshis | 99.6 /100 | #71 | Exceptional 58.4% |
| Austrians | 99.6 /100 | #72 | Exceptional 58.4% |
| Bolivians | 99.6 /100 | #73 | Exceptional 58.3% |