Immigrants from Latvia vs Immigrants from Denmark 2 or more Vehicles in Household
COMPARE
Immigrants from Latvia
Immigrants from Denmark
2 or more Vehicles in Household
2 or more Vehicles in Household Comparison
Immigrants from Latvia
Immigrants from Denmark
52.2%
2 OR MORE VEHICLES IN HOUSEHOLD
0.4/ 100
METRIC RATING
264th/ 347
METRIC RANK
55.3%
2 OR MORE VEHICLES IN HOUSEHOLD
49.4/ 100
METRIC RATING
175th/ 347
METRIC RANK
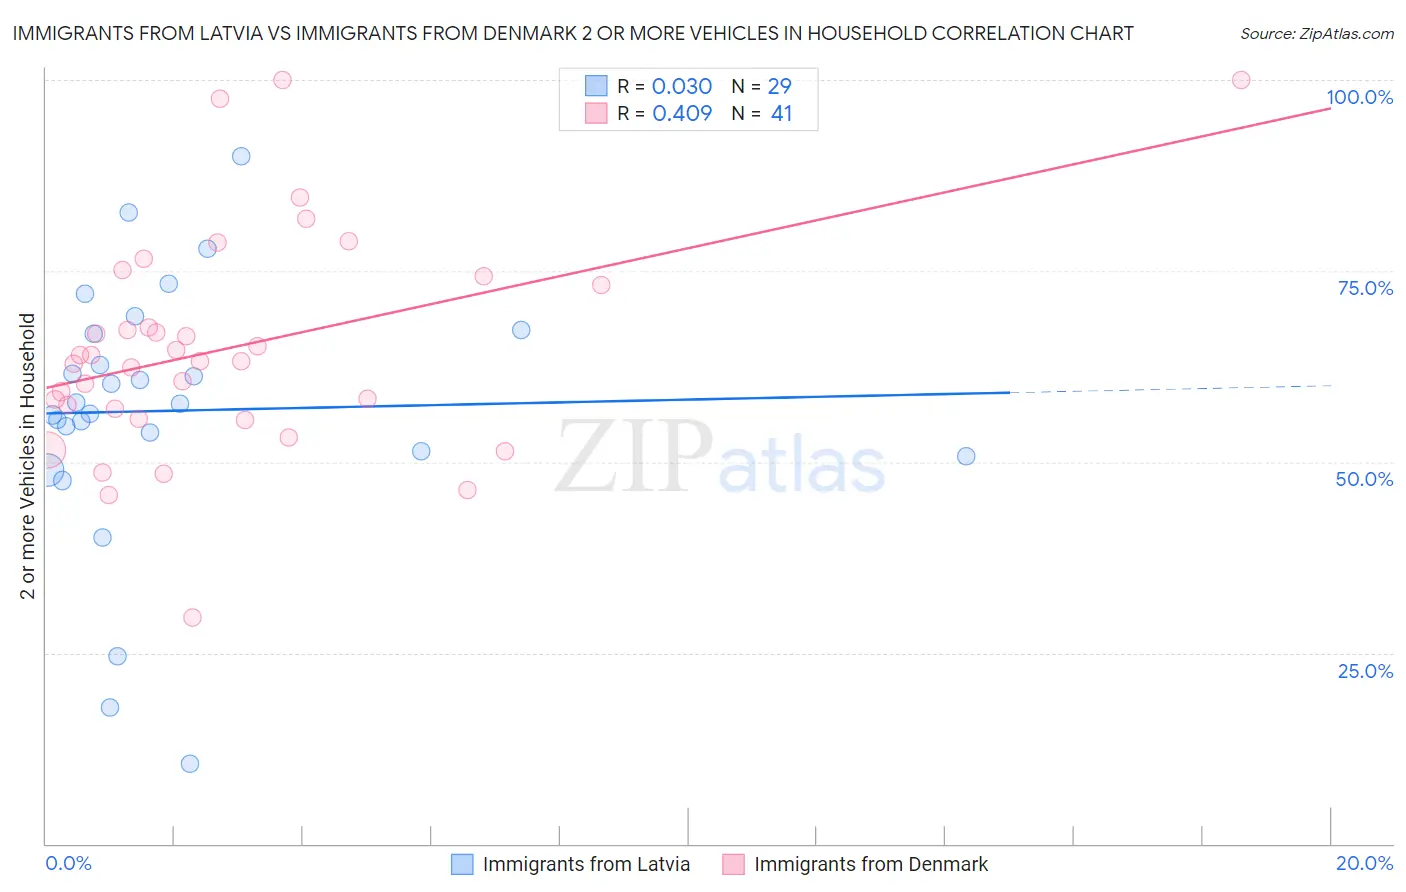
Immigrants from Latvia vs Immigrants from Denmark 2 or more Vehicles in Household Correlation Chart
The statistical analysis conducted on geographies consisting of 113,732,153 people shows no correlation between the proportion of Immigrants from Latvia and percentage of households with 2 or more vehicles available in the United States with a correlation coefficient (R) of 0.030 and weighted average of 52.2%. Similarly, the statistical analysis conducted on geographies consisting of 136,403,254 people shows a moderate positive correlation between the proportion of Immigrants from Denmark and percentage of households with 2 or more vehicles available in the United States with a correlation coefficient (R) of 0.409 and weighted average of 55.3%, a difference of 5.9%.
2 or more Vehicles in Household Correlation Summary
| Measurement | Immigrants from Latvia | Immigrants from Denmark |
| Minimum | 10.4% | 29.6% |
| Maximum | 89.9% | 100.0% |
| Range | 79.5% | 70.4% |
| Mean | 56.7% | 64.9% |
| Median | 57.6% | 63.2% |
| Interquartile 25% (IQ1) | 51.0% | 56.3% |
| Interquartile 75% (IQ3) | 67.1% | 73.8% |
| Interquartile Range (IQR) | 16.0% | 17.5% |
| Standard Deviation (Sample) | 17.3% | 14.6% |
| Standard Deviation (Population) | 17.0% | 14.4% |
Similar Demographics by 2 or more Vehicles in Household
Demographics Similar to Immigrants from Latvia by 2 or more Vehicles in Household
In terms of 2 or more vehicles in household, the demographic groups most similar to Immigrants from Latvia are Immigrants from Southern Europe (52.3%, a difference of 0.040%), Immigrants from Northern Africa (52.3%, a difference of 0.17%), Immigrants from Congo (52.1%, a difference of 0.24%), Immigrants from Australia (52.4%, a difference of 0.37%), and Immigrants from France (52.0%, a difference of 0.39%).
| Demographics | Rating | Rank | 2 or more Vehicles in Household |
| Immigrants | Hong Kong | 0.6 /100 | #257 | Tragic 52.6% |
| Central American Indians | 0.6 /100 | #258 | Tragic 52.5% |
| Alsatians | 0.6 /100 | #259 | Tragic 52.5% |
| Immigrants | Bahamas | 0.5 /100 | #260 | Tragic 52.5% |
| Immigrants | Australia | 0.5 /100 | #261 | Tragic 52.4% |
| Immigrants | Northern Africa | 0.4 /100 | #262 | Tragic 52.3% |
| Immigrants | Southern Europe | 0.4 /100 | #263 | Tragic 52.3% |
| Immigrants | Latvia | 0.4 /100 | #264 | Tragic 52.2% |
| Immigrants | Congo | 0.3 /100 | #265 | Tragic 52.1% |
| Immigrants | France | 0.2 /100 | #266 | Tragic 52.0% |
| Immigrants | Colombia | 0.2 /100 | #267 | Tragic 52.0% |
| Pima | 0.2 /100 | #268 | Tragic 52.0% |
| Hondurans | 0.2 /100 | #269 | Tragic 52.0% |
| Immigrants | Ireland | 0.2 /100 | #270 | Tragic 52.0% |
| South Americans | 0.2 /100 | #271 | Tragic 51.9% |
Demographics Similar to Immigrants from Denmark by 2 or more Vehicles in Household
In terms of 2 or more vehicles in household, the demographic groups most similar to Immigrants from Denmark are Navajo (55.3%, a difference of 0.020%), Immigrants from Western Europe (55.4%, a difference of 0.080%), Immigrants from Nicaragua (55.4%, a difference of 0.090%), Immigrants from Cuba (55.3%, a difference of 0.090%), and Menominee (55.3%, a difference of 0.13%).
| Demographics | Rating | Rank | 2 or more Vehicles in Household |
| French American Indians | 56.7 /100 | #168 | Average 55.5% |
| Immigrants | Austria | 56.3 /100 | #169 | Average 55.5% |
| Romanians | 55.8 /100 | #170 | Average 55.5% |
| Immigrants | Costa Rica | 54.4 /100 | #171 | Average 55.4% |
| Immigrants | Nicaragua | 51.6 /100 | #172 | Average 55.4% |
| Immigrants | Western Europe | 51.4 /100 | #173 | Average 55.4% |
| Navajo | 50.0 /100 | #174 | Average 55.3% |
| Immigrants | Denmark | 49.4 /100 | #175 | Average 55.3% |
| Immigrants | Cuba | 47.0 /100 | #176 | Average 55.3% |
| Menominee | 46.2 /100 | #177 | Average 55.3% |
| Immigrants | Sweden | 45.3 /100 | #178 | Average 55.2% |
| Alaskan Athabascans | 42.9 /100 | #179 | Average 55.2% |
| Immigrants | Kenya | 40.4 /100 | #180 | Average 55.1% |
| Immigrants | Micronesia | 38.2 /100 | #181 | Fair 55.1% |
| Cree | 38.2 /100 | #182 | Fair 55.1% |