Immigrants from Latvia vs Immigrants from Zaire 2 or more Vehicles in Household
COMPARE
Immigrants from Latvia
Immigrants from Zaire
2 or more Vehicles in Household
2 or more Vehicles in Household Comparison
Immigrants from Latvia
Immigrants from Zaire
52.2%
2 OR MORE VEHICLES IN HOUSEHOLD
0.4/ 100
METRIC RATING
264th/ 347
METRIC RANK
51.5%
2 OR MORE VEHICLES IN HOUSEHOLD
0.1/ 100
METRIC RATING
284th/ 347
METRIC RANK
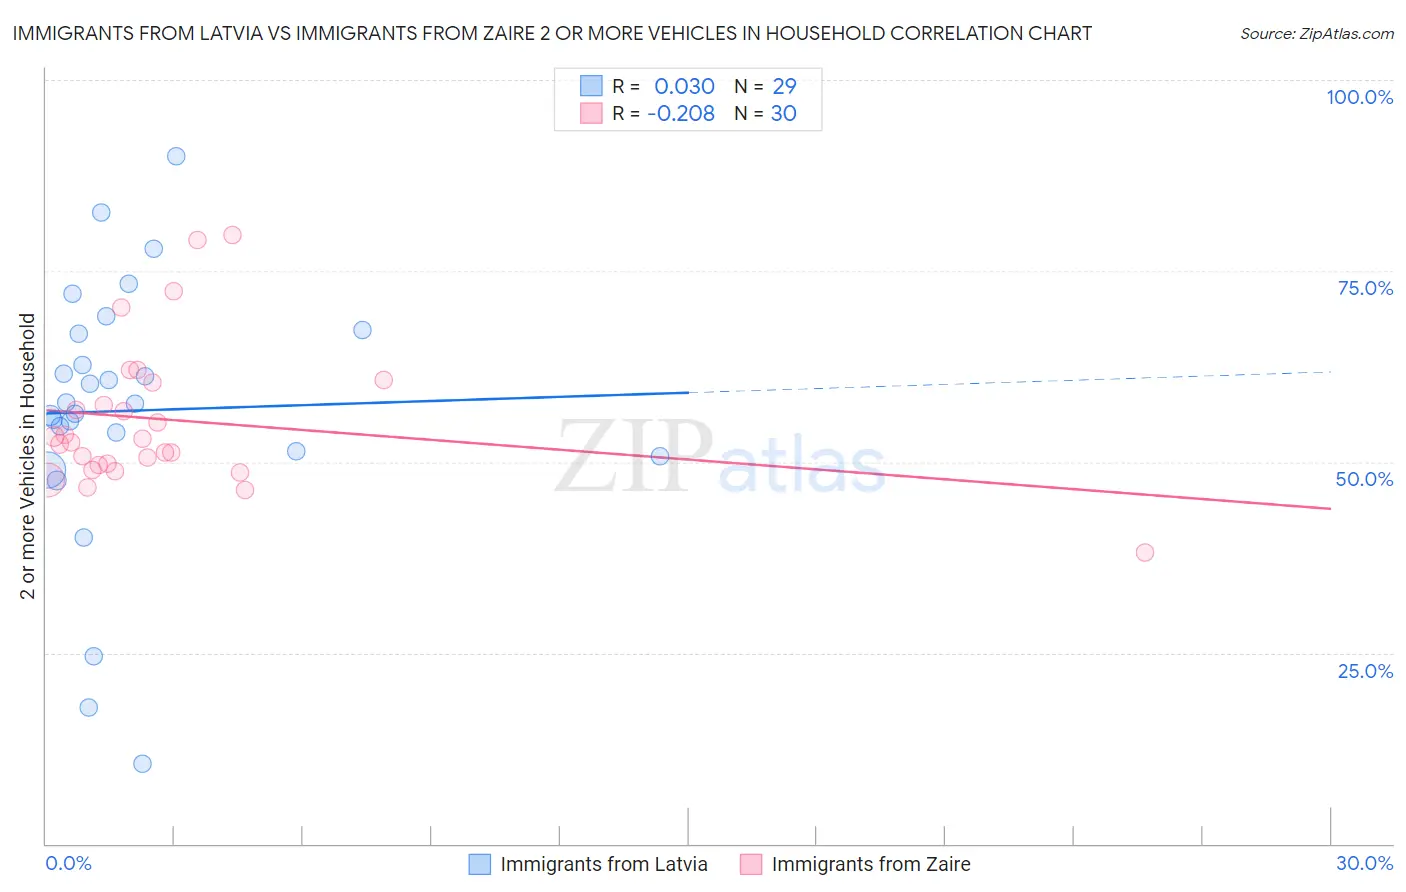
Immigrants from Latvia vs Immigrants from Zaire 2 or more Vehicles in Household Correlation Chart
The statistical analysis conducted on geographies consisting of 113,732,153 people shows no correlation between the proportion of Immigrants from Latvia and percentage of households with 2 or more vehicles available in the United States with a correlation coefficient (R) of 0.030 and weighted average of 52.2%. Similarly, the statistical analysis conducted on geographies consisting of 107,246,082 people shows a weak negative correlation between the proportion of Immigrants from Zaire and percentage of households with 2 or more vehicles available in the United States with a correlation coefficient (R) of -0.208 and weighted average of 51.5%, a difference of 1.5%.
2 or more Vehicles in Household Correlation Summary
| Measurement | Immigrants from Latvia | Immigrants from Zaire |
| Minimum | 10.4% | 38.1% |
| Maximum | 89.9% | 79.7% |
| Range | 79.5% | 41.6% |
| Mean | 56.7% | 55.5% |
| Median | 57.6% | 52.7% |
| Interquartile 25% (IQ1) | 51.0% | 49.5% |
| Interquartile 75% (IQ3) | 67.1% | 60.4% |
| Interquartile Range (IQR) | 16.0% | 10.8% |
| Standard Deviation (Sample) | 17.3% | 9.5% |
| Standard Deviation (Population) | 17.0% | 9.4% |
Demographics Similar to Immigrants from Latvia and Immigrants from Zaire by 2 or more Vehicles in Household
In terms of 2 or more vehicles in household, the demographic groups most similar to Immigrants from Latvia are Immigrants from Congo (52.1%, a difference of 0.24%), Immigrants from France (52.0%, a difference of 0.39%), Immigrants from Colombia (52.0%, a difference of 0.43%), Pima (52.0%, a difference of 0.44%), and Honduran (52.0%, a difference of 0.45%). Similarly, the demographic groups most similar to Immigrants from Zaire are Immigrants from China (51.5%, a difference of 0.040%), Bahamian (51.5%, a difference of 0.12%), Immigrants from Kazakhstan (51.6%, a difference of 0.18%), Immigrants from Eastern Europe (51.7%, a difference of 0.49%), and Yuman (51.7%, a difference of 0.53%).
| Demographics | Rating | Rank | 2 or more Vehicles in Household |
| Immigrants | Latvia | 0.4 /100 | #264 | Tragic 52.2% |
| Immigrants | Congo | 0.3 /100 | #265 | Tragic 52.1% |
| Immigrants | France | 0.2 /100 | #266 | Tragic 52.0% |
| Immigrants | Colombia | 0.2 /100 | #267 | Tragic 52.0% |
| Pima | 0.2 /100 | #268 | Tragic 52.0% |
| Hondurans | 0.2 /100 | #269 | Tragic 52.0% |
| Immigrants | Ireland | 0.2 /100 | #270 | Tragic 52.0% |
| South Americans | 0.2 /100 | #271 | Tragic 51.9% |
| Sub-Saharan Africans | 0.2 /100 | #272 | Tragic 51.9% |
| Israelis | 0.2 /100 | #273 | Tragic 51.9% |
| Africans | 0.2 /100 | #274 | Tragic 51.8% |
| Immigrants | Honduras | 0.2 /100 | #275 | Tragic 51.8% |
| Immigrants | Croatia | 0.2 /100 | #276 | Tragic 51.8% |
| Immigrants | Africa | 0.2 /100 | #277 | Tragic 51.8% |
| Yuman | 0.1 /100 | #278 | Tragic 51.7% |
| Liberians | 0.1 /100 | #279 | Tragic 51.7% |
| Immigrants | Eastern Europe | 0.1 /100 | #280 | Tragic 51.7% |
| Immigrants | Kazakhstan | 0.1 /100 | #281 | Tragic 51.6% |
| Bahamians | 0.1 /100 | #282 | Tragic 51.5% |
| Immigrants | China | 0.1 /100 | #283 | Tragic 51.5% |
| Immigrants | Zaire | 0.1 /100 | #284 | Tragic 51.5% |