Apache vs Croatian 2 or more Vehicles in Household
COMPARE
Apache
Croatian
2 or more Vehicles in Household
2 or more Vehicles in Household Comparison
Apache
Croatians
55.1%
2 OR MORE VEHICLES IN HOUSEHOLD
36.7/ 100
METRIC RATING
184th/ 347
METRIC RANK
58.6%
2 OR MORE VEHICLES IN HOUSEHOLD
99.7/ 100
METRIC RATING
66th/ 347
METRIC RANK
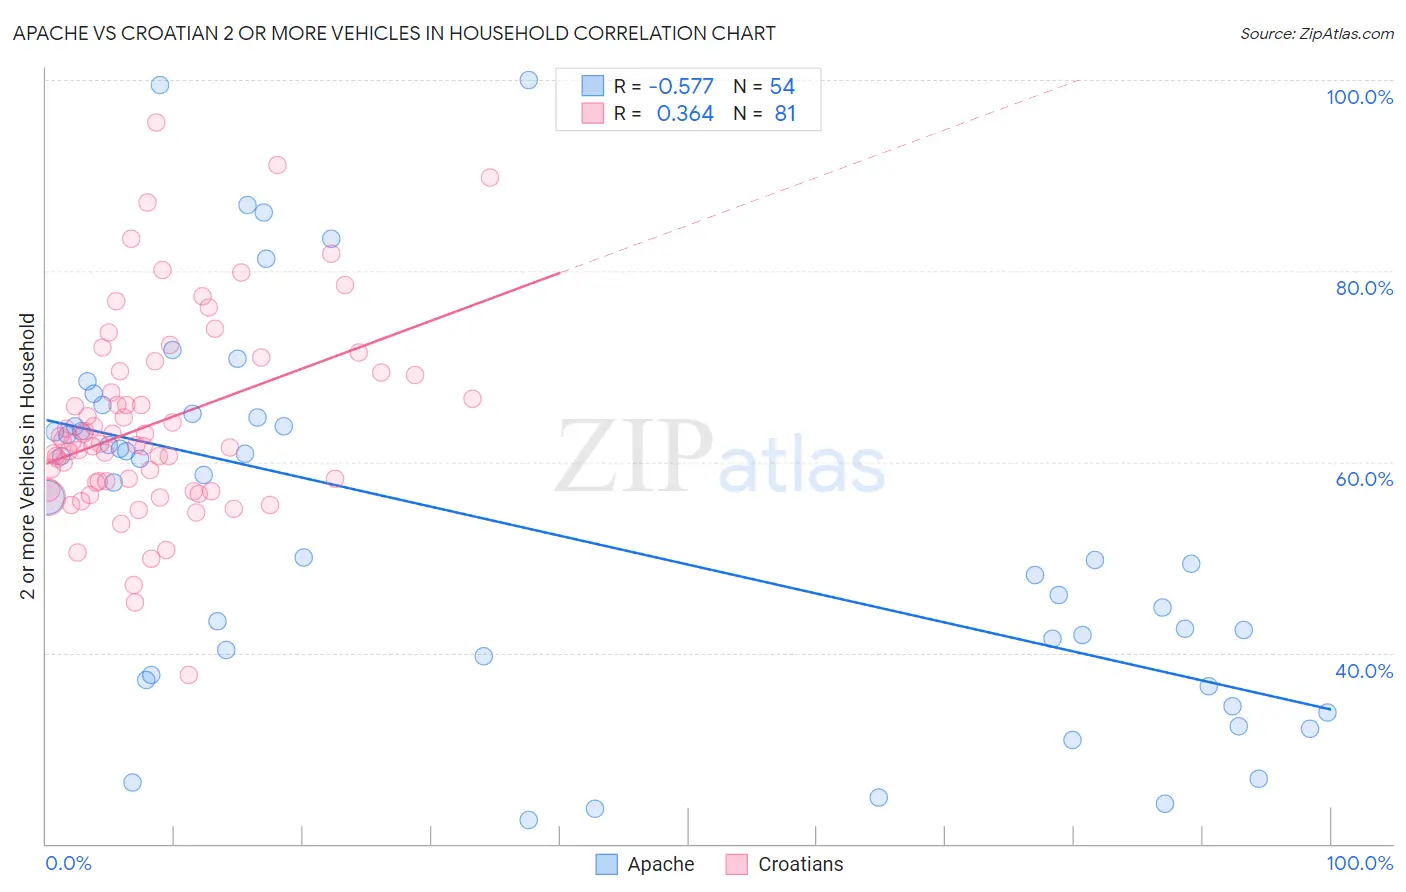
Apache vs Croatian 2 or more Vehicles in Household Correlation Chart
The statistical analysis conducted on geographies consisting of 231,042,318 people shows a substantial negative correlation between the proportion of Apache and percentage of households with 2 or more vehicles available in the United States with a correlation coefficient (R) of -0.577 and weighted average of 55.1%. Similarly, the statistical analysis conducted on geographies consisting of 375,571,989 people shows a mild positive correlation between the proportion of Croatians and percentage of households with 2 or more vehicles available in the United States with a correlation coefficient (R) of 0.364 and weighted average of 58.6%, a difference of 6.4%.
2 or more Vehicles in Household Correlation Summary
| Measurement | Apache | Croatian |
| Minimum | 22.4% | 37.6% |
| Maximum | 100.0% | 95.6% |
| Range | 77.6% | 57.9% |
| Mean | 53.1% | 64.1% |
| Median | 53.1% | 61.9% |
| Interquartile 25% (IQ1) | 37.7% | 57.4% |
| Interquartile 75% (IQ3) | 63.7% | 69.4% |
| Interquartile Range (IQR) | 26.0% | 12.0% |
| Standard Deviation (Sample) | 19.2% | 10.4% |
| Standard Deviation (Population) | 19.1% | 10.3% |
Similar Demographics by 2 or more Vehicles in Household
Demographics Similar to Apache by 2 or more Vehicles in Household
In terms of 2 or more vehicles in household, the demographic groups most similar to Apache are Immigrants from Cameroon (55.1%, a difference of 0.030%), Arab (55.0%, a difference of 0.030%), Immigrants from Micronesia (55.1%, a difference of 0.060%), Cree (55.1%, a difference of 0.060%), and Peruvian (55.0%, a difference of 0.13%).
| Demographics | Rating | Rank | 2 or more Vehicles in Household |
| Menominee | 46.2 /100 | #177 | Average 55.3% |
| Immigrants | Sweden | 45.3 /100 | #178 | Average 55.2% |
| Alaskan Athabascans | 42.9 /100 | #179 | Average 55.2% |
| Immigrants | Kenya | 40.4 /100 | #180 | Average 55.1% |
| Immigrants | Micronesia | 38.2 /100 | #181 | Fair 55.1% |
| Cree | 38.2 /100 | #182 | Fair 55.1% |
| Immigrants | Cameroon | 37.3 /100 | #183 | Fair 55.1% |
| Apache | 36.7 /100 | #184 | Fair 55.1% |
| Arabs | 35.9 /100 | #185 | Fair 55.0% |
| Peruvians | 33.7 /100 | #186 | Fair 55.0% |
| Immigrants | Uganda | 33.4 /100 | #187 | Fair 55.0% |
| Marshallese | 30.5 /100 | #188 | Fair 54.9% |
| Eastern Europeans | 27.5 /100 | #189 | Fair 54.8% |
| Russians | 26.3 /100 | #190 | Fair 54.8% |
| Immigrants | Immigrants | 25.0 /100 | #191 | Fair 54.7% |
Demographics Similar to Croatians by 2 or more Vehicles in Household
In terms of 2 or more vehicles in household, the demographic groups most similar to Croatians are Immigrants from Central America (58.6%, a difference of 0.010%), Laotian (58.6%, a difference of 0.020%), Canadian (58.6%, a difference of 0.030%), Portuguese (58.6%, a difference of 0.060%), and Pennsylvania German (58.5%, a difference of 0.15%).
| Demographics | Rating | Rank | 2 or more Vehicles in Household |
| Spanish Americans | 99.8 /100 | #59 | Exceptional 58.9% |
| French Canadians | 99.8 /100 | #60 | Exceptional 58.9% |
| Osage | 99.8 /100 | #61 | Exceptional 58.8% |
| Immigrants | Nonimmigrants | 99.8 /100 | #62 | Exceptional 58.8% |
| Mexican American Indians | 99.8 /100 | #63 | Exceptional 58.7% |
| Portuguese | 99.7 /100 | #64 | Exceptional 58.6% |
| Immigrants | Central America | 99.7 /100 | #65 | Exceptional 58.6% |
| Croatians | 99.7 /100 | #66 | Exceptional 58.6% |
| Laotians | 99.7 /100 | #67 | Exceptional 58.6% |
| Canadians | 99.7 /100 | #68 | Exceptional 58.6% |
| Pennsylvania Germans | 99.7 /100 | #69 | Exceptional 58.5% |
| Italians | 99.6 /100 | #70 | Exceptional 58.4% |
| Bangladeshis | 99.6 /100 | #71 | Exceptional 58.4% |
| Austrians | 99.6 /100 | #72 | Exceptional 58.4% |
| Bolivians | 99.6 /100 | #73 | Exceptional 58.3% |