Immigrants from Latvia vs Moroccan 2 or more Vehicles in Household
COMPARE
Immigrants from Latvia
Moroccan
2 or more Vehicles in Household
2 or more Vehicles in Household Comparison
Immigrants from Latvia
Moroccans
52.2%
2 OR MORE VEHICLES IN HOUSEHOLD
0.4/ 100
METRIC RATING
264th/ 347
METRIC RANK
48.8%
2 OR MORE VEHICLES IN HOUSEHOLD
0.0/ 100
METRIC RATING
309th/ 347
METRIC RANK
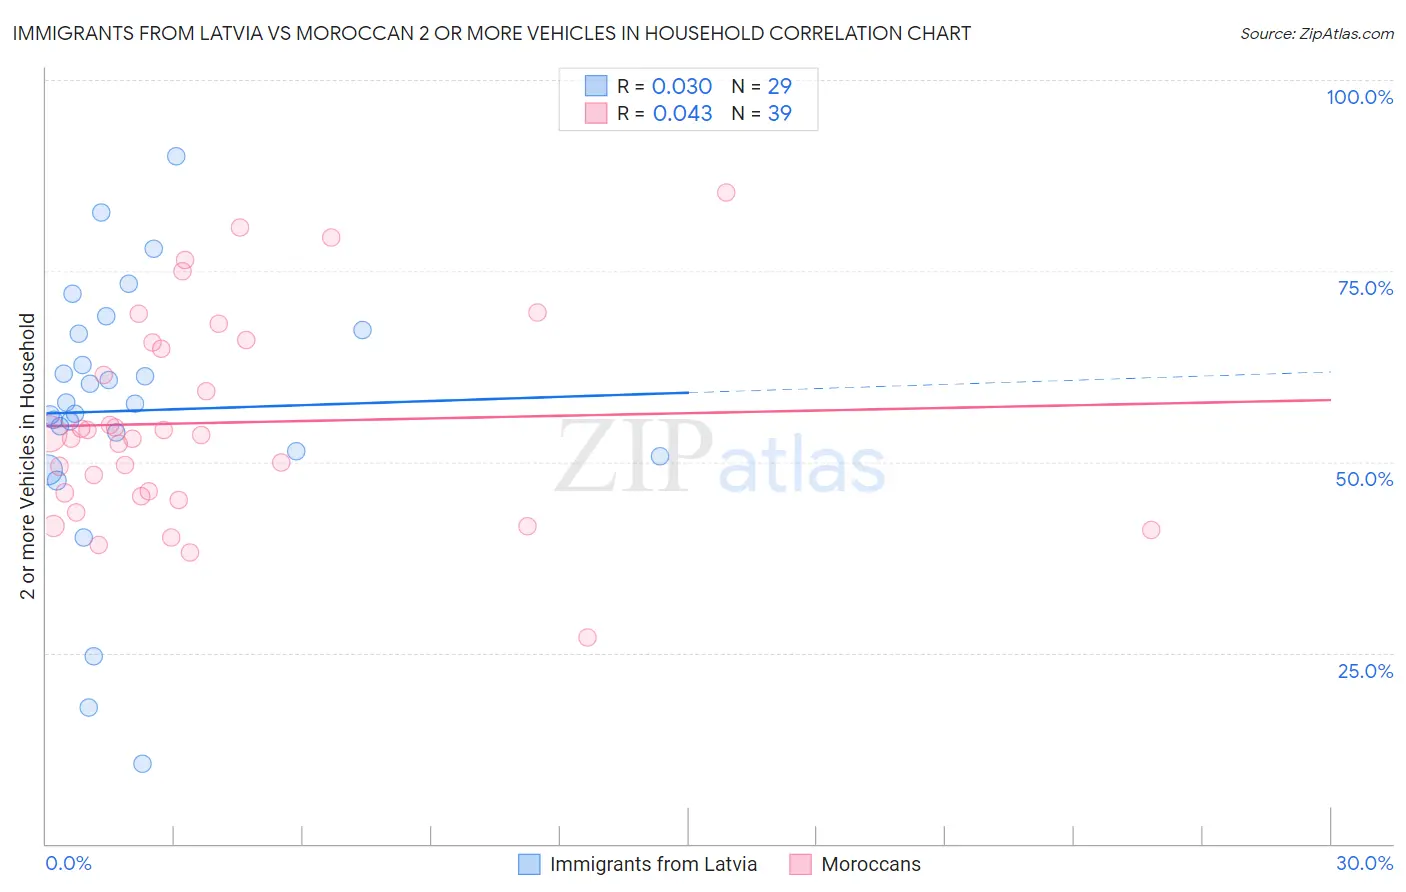
Immigrants from Latvia vs Moroccan 2 or more Vehicles in Household Correlation Chart
The statistical analysis conducted on geographies consisting of 113,732,153 people shows no correlation between the proportion of Immigrants from Latvia and percentage of households with 2 or more vehicles available in the United States with a correlation coefficient (R) of 0.030 and weighted average of 52.2%. Similarly, the statistical analysis conducted on geographies consisting of 201,766,092 people shows no correlation between the proportion of Moroccans and percentage of households with 2 or more vehicles available in the United States with a correlation coefficient (R) of 0.043 and weighted average of 48.8%, a difference of 7.0%.
2 or more Vehicles in Household Correlation Summary
| Measurement | Immigrants from Latvia | Moroccan |
| Minimum | 10.4% | 27.0% |
| Maximum | 89.9% | 85.3% |
| Range | 79.5% | 58.3% |
| Mean | 56.7% | 55.1% |
| Median | 57.6% | 53.5% |
| Interquartile 25% (IQ1) | 51.0% | 45.6% |
| Interquartile 75% (IQ3) | 67.1% | 65.6% |
| Interquartile Range (IQR) | 16.0% | 20.0% |
| Standard Deviation (Sample) | 17.3% | 13.3% |
| Standard Deviation (Population) | 17.0% | 13.1% |
Similar Demographics by 2 or more Vehicles in Household
Demographics Similar to Immigrants from Latvia by 2 or more Vehicles in Household
In terms of 2 or more vehicles in household, the demographic groups most similar to Immigrants from Latvia are Immigrants from Southern Europe (52.3%, a difference of 0.040%), Immigrants from Northern Africa (52.3%, a difference of 0.17%), Immigrants from Congo (52.1%, a difference of 0.24%), Immigrants from Australia (52.4%, a difference of 0.37%), and Immigrants from France (52.0%, a difference of 0.39%).
| Demographics | Rating | Rank | 2 or more Vehicles in Household |
| Immigrants | Hong Kong | 0.6 /100 | #257 | Tragic 52.6% |
| Central American Indians | 0.6 /100 | #258 | Tragic 52.5% |
| Alsatians | 0.6 /100 | #259 | Tragic 52.5% |
| Immigrants | Bahamas | 0.5 /100 | #260 | Tragic 52.5% |
| Immigrants | Australia | 0.5 /100 | #261 | Tragic 52.4% |
| Immigrants | Northern Africa | 0.4 /100 | #262 | Tragic 52.3% |
| Immigrants | Southern Europe | 0.4 /100 | #263 | Tragic 52.3% |
| Immigrants | Latvia | 0.4 /100 | #264 | Tragic 52.2% |
| Immigrants | Congo | 0.3 /100 | #265 | Tragic 52.1% |
| Immigrants | France | 0.2 /100 | #266 | Tragic 52.0% |
| Immigrants | Colombia | 0.2 /100 | #267 | Tragic 52.0% |
| Pima | 0.2 /100 | #268 | Tragic 52.0% |
| Hondurans | 0.2 /100 | #269 | Tragic 52.0% |
| Immigrants | Ireland | 0.2 /100 | #270 | Tragic 52.0% |
| South Americans | 0.2 /100 | #271 | Tragic 51.9% |
Demographics Similar to Moroccans by 2 or more Vehicles in Household
In terms of 2 or more vehicles in household, the demographic groups most similar to Moroccans are Albanian (49.0%, a difference of 0.35%), Hopi (49.0%, a difference of 0.42%), Immigrants from Israel (49.2%, a difference of 0.85%), Immigrants from Western Africa (49.4%, a difference of 1.1%), and Ghanaian (48.0%, a difference of 1.8%).
| Demographics | Rating | Rank | 2 or more Vehicles in Household |
| Immigrants | South America | 0.0 /100 | #302 | Tragic 50.2% |
| Tohono O'odham | 0.0 /100 | #303 | Tragic 50.0% |
| Immigrants | Belize | 0.0 /100 | #304 | Tragic 49.9% |
| Immigrants | Western Africa | 0.0 /100 | #305 | Tragic 49.4% |
| Immigrants | Israel | 0.0 /100 | #306 | Tragic 49.2% |
| Hopi | 0.0 /100 | #307 | Tragic 49.0% |
| Albanians | 0.0 /100 | #308 | Tragic 49.0% |
| Moroccans | 0.0 /100 | #309 | Tragic 48.8% |
| Ghanaians | 0.0 /100 | #310 | Tragic 48.0% |
| Immigrants | Belarus | 0.0 /100 | #311 | Tragic 47.9% |
| Haitians | 0.0 /100 | #312 | Tragic 47.6% |
| U.S. Virgin Islanders | 0.0 /100 | #313 | Tragic 47.5% |
| Immigrants | Ghana | 0.0 /100 | #314 | Tragic 47.4% |
| Puerto Ricans | 0.0 /100 | #315 | Tragic 47.1% |
| Cape Verdeans | 0.0 /100 | #316 | Tragic 46.8% |