Immigrants from Latvia vs Immigrants from Japan 2 or more Vehicles in Household
COMPARE
Immigrants from Latvia
Immigrants from Japan
2 or more Vehicles in Household
2 or more Vehicles in Household Comparison
Immigrants from Latvia
Immigrants from Japan
52.2%
2 OR MORE VEHICLES IN HOUSEHOLD
0.4/ 100
METRIC RATING
264th/ 347
METRIC RANK
54.7%
2 OR MORE VEHICLES IN HOUSEHOLD
23.4/ 100
METRIC RATING
193rd/ 347
METRIC RANK
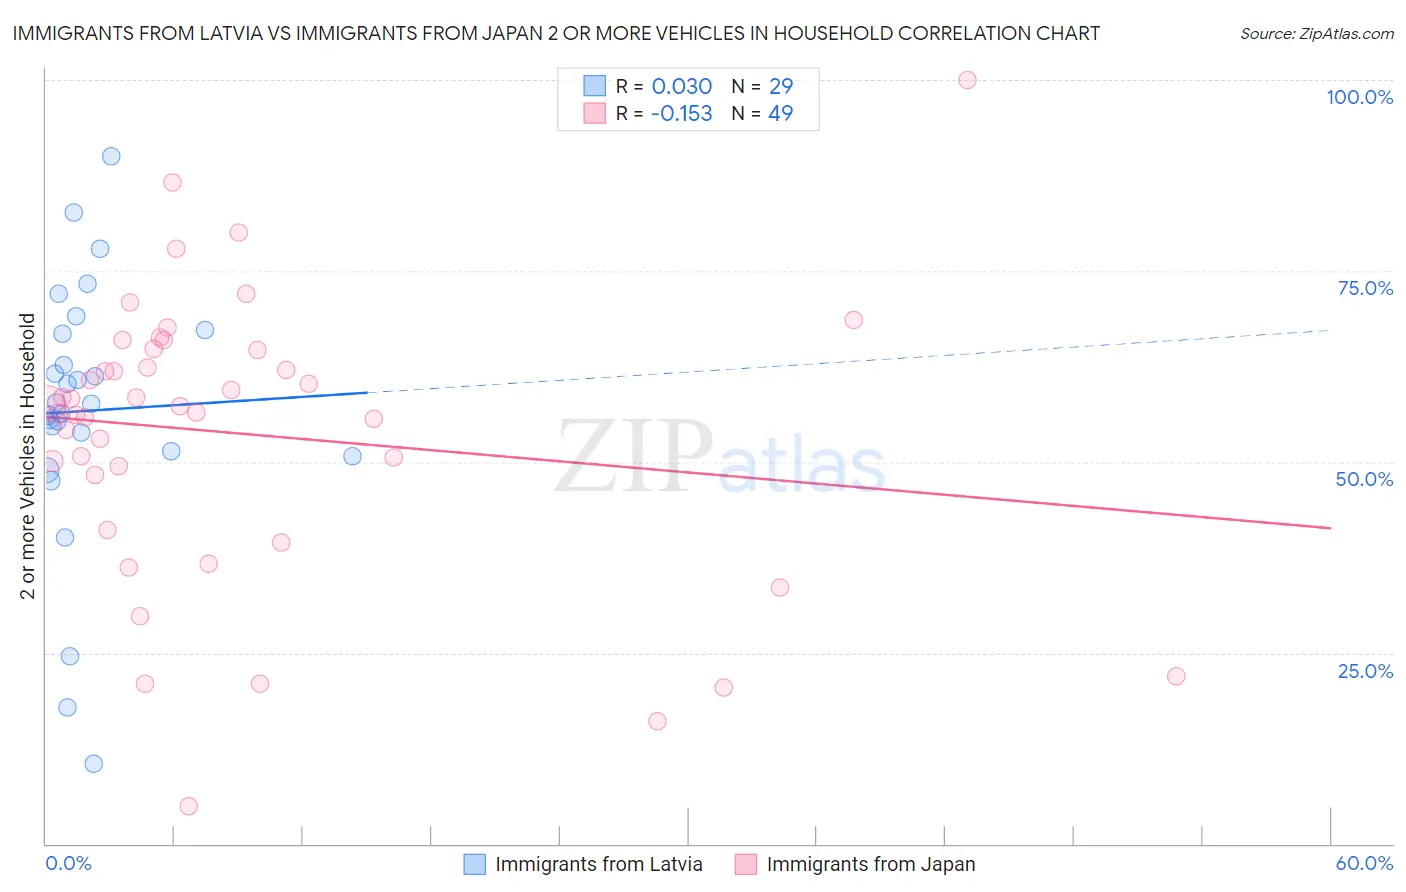
Immigrants from Latvia vs Immigrants from Japan 2 or more Vehicles in Household Correlation Chart
The statistical analysis conducted on geographies consisting of 113,732,153 people shows no correlation between the proportion of Immigrants from Latvia and percentage of households with 2 or more vehicles available in the United States with a correlation coefficient (R) of 0.030 and weighted average of 52.2%. Similarly, the statistical analysis conducted on geographies consisting of 340,014,112 people shows a poor negative correlation between the proportion of Immigrants from Japan and percentage of households with 2 or more vehicles available in the United States with a correlation coefficient (R) of -0.153 and weighted average of 54.7%, a difference of 4.7%.
2 or more Vehicles in Household Correlation Summary
| Measurement | Immigrants from Latvia | Immigrants from Japan |
| Minimum | 10.4% | 4.9% |
| Maximum | 89.9% | 100.0% |
| Range | 79.5% | 95.1% |
| Mean | 56.7% | 53.6% |
| Median | 57.6% | 57.3% |
| Interquartile 25% (IQ1) | 51.0% | 44.7% |
| Interquartile 75% (IQ3) | 67.1% | 64.8% |
| Interquartile Range (IQR) | 16.0% | 20.1% |
| Standard Deviation (Sample) | 17.3% | 18.7% |
| Standard Deviation (Population) | 17.0% | 18.5% |
Similar Demographics by 2 or more Vehicles in Household
Demographics Similar to Immigrants from Latvia by 2 or more Vehicles in Household
In terms of 2 or more vehicles in household, the demographic groups most similar to Immigrants from Latvia are Immigrants from Southern Europe (52.3%, a difference of 0.040%), Immigrants from Northern Africa (52.3%, a difference of 0.17%), Immigrants from Congo (52.1%, a difference of 0.24%), Immigrants from Australia (52.4%, a difference of 0.37%), and Immigrants from France (52.0%, a difference of 0.39%).
| Demographics | Rating | Rank | 2 or more Vehicles in Household |
| Immigrants | Hong Kong | 0.6 /100 | #257 | Tragic 52.6% |
| Central American Indians | 0.6 /100 | #258 | Tragic 52.5% |
| Alsatians | 0.6 /100 | #259 | Tragic 52.5% |
| Immigrants | Bahamas | 0.5 /100 | #260 | Tragic 52.5% |
| Immigrants | Australia | 0.5 /100 | #261 | Tragic 52.4% |
| Immigrants | Northern Africa | 0.4 /100 | #262 | Tragic 52.3% |
| Immigrants | Southern Europe | 0.4 /100 | #263 | Tragic 52.3% |
| Immigrants | Latvia | 0.4 /100 | #264 | Tragic 52.2% |
| Immigrants | Congo | 0.3 /100 | #265 | Tragic 52.1% |
| Immigrants | France | 0.2 /100 | #266 | Tragic 52.0% |
| Immigrants | Colombia | 0.2 /100 | #267 | Tragic 52.0% |
| Pima | 0.2 /100 | #268 | Tragic 52.0% |
| Hondurans | 0.2 /100 | #269 | Tragic 52.0% |
| Immigrants | Ireland | 0.2 /100 | #270 | Tragic 52.0% |
| South Americans | 0.2 /100 | #271 | Tragic 51.9% |
Demographics Similar to Immigrants from Japan by 2 or more Vehicles in Household
In terms of 2 or more vehicles in household, the demographic groups most similar to Immigrants from Japan are Immigrants from Romania (54.7%, a difference of 0.020%), Central American (54.7%, a difference of 0.020%), Iroquois (54.7%, a difference of 0.050%), Immigrants (54.7%, a difference of 0.090%), and Russian (54.8%, a difference of 0.16%).
| Demographics | Rating | Rank | 2 or more Vehicles in Household |
| Peruvians | 33.7 /100 | #186 | Fair 55.0% |
| Immigrants | Uganda | 33.4 /100 | #187 | Fair 55.0% |
| Marshallese | 30.5 /100 | #188 | Fair 54.9% |
| Eastern Europeans | 27.5 /100 | #189 | Fair 54.8% |
| Russians | 26.3 /100 | #190 | Fair 54.8% |
| Immigrants | Immigrants | 25.0 /100 | #191 | Fair 54.7% |
| Immigrants | Romania | 23.8 /100 | #192 | Fair 54.7% |
| Immigrants | Japan | 23.4 /100 | #193 | Fair 54.7% |
| Central Americans | 23.0 /100 | #194 | Fair 54.7% |
| Iroquois | 22.6 /100 | #195 | Fair 54.7% |
| Immigrants | Poland | 19.3 /100 | #196 | Poor 54.6% |
| Argentineans | 17.5 /100 | #197 | Poor 54.5% |
| Carpatho Rusyns | 16.2 /100 | #198 | Poor 54.4% |
| Immigrants | Norway | 15.9 /100 | #199 | Poor 54.4% |
| Houma | 15.8 /100 | #200 | Poor 54.4% |