Immigrants from Latvia vs Immigrants from Uzbekistan 2 or more Vehicles in Household
COMPARE
Immigrants from Latvia
Immigrants from Uzbekistan
2 or more Vehicles in Household
2 or more Vehicles in Household Comparison
Immigrants from Latvia
Immigrants from Uzbekistan
52.2%
2 OR MORE VEHICLES IN HOUSEHOLD
0.4/ 100
METRIC RATING
264th/ 347
METRIC RANK
37.9%
2 OR MORE VEHICLES IN HOUSEHOLD
0.0/ 100
METRIC RATING
338th/ 347
METRIC RANK
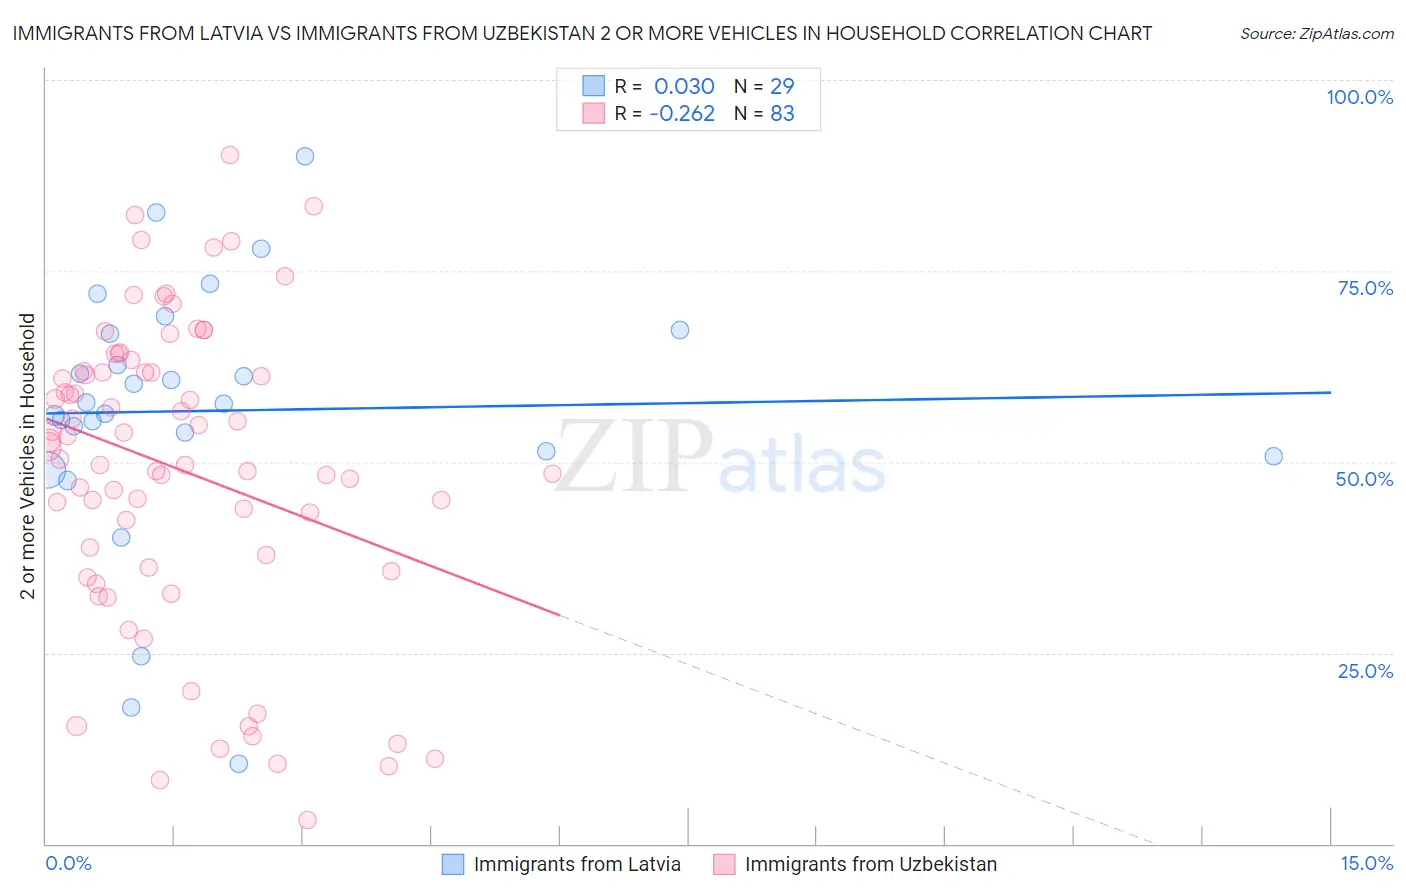
Immigrants from Latvia vs Immigrants from Uzbekistan 2 or more Vehicles in Household Correlation Chart
The statistical analysis conducted on geographies consisting of 113,732,153 people shows no correlation between the proportion of Immigrants from Latvia and percentage of households with 2 or more vehicles available in the United States with a correlation coefficient (R) of 0.030 and weighted average of 52.2%. Similarly, the statistical analysis conducted on geographies consisting of 118,723,370 people shows a weak negative correlation between the proportion of Immigrants from Uzbekistan and percentage of households with 2 or more vehicles available in the United States with a correlation coefficient (R) of -0.262 and weighted average of 37.9%, a difference of 37.9%.
2 or more Vehicles in Household Correlation Summary
| Measurement | Immigrants from Latvia | Immigrants from Uzbekistan |
| Minimum | 10.4% | 3.0% |
| Maximum | 89.9% | 90.2% |
| Range | 79.5% | 87.1% |
| Mean | 56.7% | 49.1% |
| Median | 57.6% | 52.0% |
| Interquartile 25% (IQ1) | 51.0% | 36.2% |
| Interquartile 75% (IQ3) | 67.1% | 61.9% |
| Interquartile Range (IQR) | 16.0% | 25.7% |
| Standard Deviation (Sample) | 17.3% | 20.0% |
| Standard Deviation (Population) | 17.0% | 19.9% |
Similar Demographics by 2 or more Vehicles in Household
Demographics Similar to Immigrants from Latvia by 2 or more Vehicles in Household
In terms of 2 or more vehicles in household, the demographic groups most similar to Immigrants from Latvia are Immigrants from Southern Europe (52.3%, a difference of 0.040%), Immigrants from Northern Africa (52.3%, a difference of 0.17%), Immigrants from Congo (52.1%, a difference of 0.24%), Immigrants from Australia (52.4%, a difference of 0.37%), and Immigrants from France (52.0%, a difference of 0.39%).
| Demographics | Rating | Rank | 2 or more Vehicles in Household |
| Immigrants | Hong Kong | 0.6 /100 | #257 | Tragic 52.6% |
| Central American Indians | 0.6 /100 | #258 | Tragic 52.5% |
| Alsatians | 0.6 /100 | #259 | Tragic 52.5% |
| Immigrants | Bahamas | 0.5 /100 | #260 | Tragic 52.5% |
| Immigrants | Australia | 0.5 /100 | #261 | Tragic 52.4% |
| Immigrants | Northern Africa | 0.4 /100 | #262 | Tragic 52.3% |
| Immigrants | Southern Europe | 0.4 /100 | #263 | Tragic 52.3% |
| Immigrants | Latvia | 0.4 /100 | #264 | Tragic 52.2% |
| Immigrants | Congo | 0.3 /100 | #265 | Tragic 52.1% |
| Immigrants | France | 0.2 /100 | #266 | Tragic 52.0% |
| Immigrants | Colombia | 0.2 /100 | #267 | Tragic 52.0% |
| Pima | 0.2 /100 | #268 | Tragic 52.0% |
| Hondurans | 0.2 /100 | #269 | Tragic 52.0% |
| Immigrants | Ireland | 0.2 /100 | #270 | Tragic 52.0% |
| South Americans | 0.2 /100 | #271 | Tragic 51.9% |
Demographics Similar to Immigrants from Uzbekistan by 2 or more Vehicles in Household
In terms of 2 or more vehicles in household, the demographic groups most similar to Immigrants from Uzbekistan are Barbadian (38.3%, a difference of 1.2%), Vietnamese (38.5%, a difference of 1.6%), Immigrants from Bangladesh (38.8%, a difference of 2.3%), Immigrants from Barbados (35.8%, a difference of 5.9%), and Immigrants from Trinidad and Tobago (40.3%, a difference of 6.3%).
| Demographics | Rating | Rank | 2 or more Vehicles in Household |
| West Indians | 0.0 /100 | #331 | Tragic 41.3% |
| Trinidadians and Tobagonians | 0.0 /100 | #332 | Tragic 40.9% |
| Immigrants | Ecuador | 0.0 /100 | #333 | Tragic 40.5% |
| Immigrants | Trinidad and Tobago | 0.0 /100 | #334 | Tragic 40.3% |
| Immigrants | Bangladesh | 0.0 /100 | #335 | Tragic 38.8% |
| Vietnamese | 0.0 /100 | #336 | Tragic 38.5% |
| Barbadians | 0.0 /100 | #337 | Tragic 38.3% |
| Immigrants | Uzbekistan | 0.0 /100 | #338 | Tragic 37.9% |
| Immigrants | Barbados | 0.0 /100 | #339 | Tragic 35.8% |
| British West Indians | 0.0 /100 | #340 | Tragic 35.4% |
| Guyanese | 0.0 /100 | #341 | Tragic 35.4% |
| Dominicans | 0.0 /100 | #342 | Tragic 35.3% |
| Immigrants | Guyana | 0.0 /100 | #343 | Tragic 35.0% |
| Yup'ik | 0.0 /100 | #344 | Tragic 34.9% |
| Immigrants | Dominican Republic | 0.0 /100 | #345 | Tragic 33.2% |