Iraqi vs Croatian 2 or more Vehicles in Household
COMPARE
Iraqi
Croatian
2 or more Vehicles in Household
2 or more Vehicles in Household Comparison
Iraqis
Croatians
57.1%
2 OR MORE VEHICLES IN HOUSEHOLD
95.8/ 100
METRIC RATING
117th/ 347
METRIC RANK
58.6%
2 OR MORE VEHICLES IN HOUSEHOLD
99.7/ 100
METRIC RATING
66th/ 347
METRIC RANK
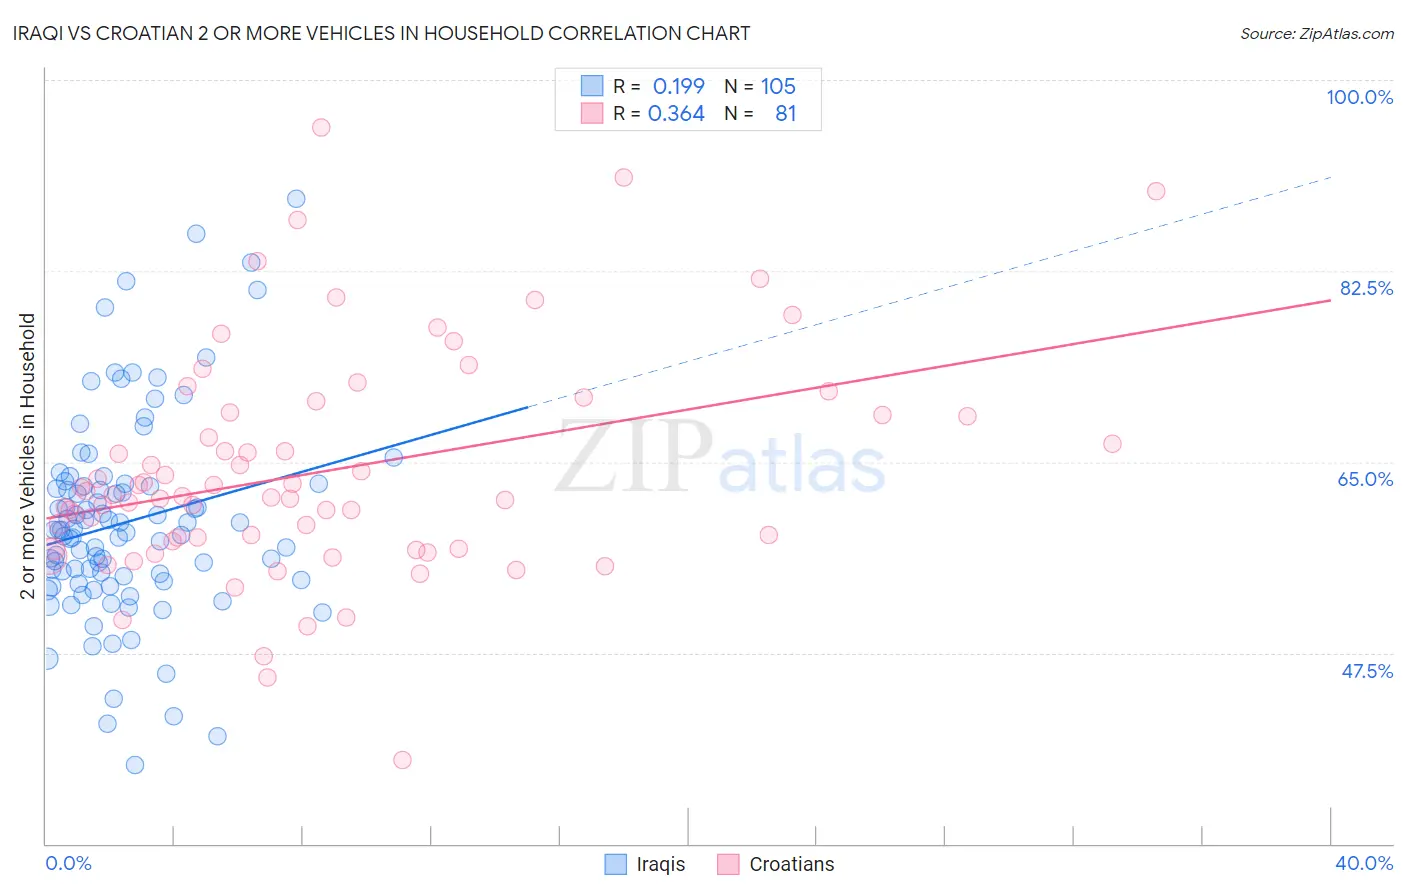
Iraqi vs Croatian 2 or more Vehicles in Household Correlation Chart
The statistical analysis conducted on geographies consisting of 170,650,465 people shows a poor positive correlation between the proportion of Iraqis and percentage of households with 2 or more vehicles available in the United States with a correlation coefficient (R) of 0.199 and weighted average of 57.1%. Similarly, the statistical analysis conducted on geographies consisting of 375,571,989 people shows a mild positive correlation between the proportion of Croatians and percentage of households with 2 or more vehicles available in the United States with a correlation coefficient (R) of 0.364 and weighted average of 58.6%, a difference of 2.7%.
2 or more Vehicles in Household Correlation Summary
| Measurement | Iraqi | Croatian |
| Minimum | 37.2% | 37.6% |
| Maximum | 89.1% | 95.6% |
| Range | 51.9% | 57.9% |
| Mean | 59.5% | 64.1% |
| Median | 58.7% | 61.9% |
| Interquartile 25% (IQ1) | 54.1% | 57.4% |
| Interquartile 75% (IQ3) | 62.9% | 69.4% |
| Interquartile Range (IQR) | 8.7% | 12.0% |
| Standard Deviation (Sample) | 9.3% | 10.4% |
| Standard Deviation (Population) | 9.3% | 10.3% |
Similar Demographics by 2 or more Vehicles in Household
Demographics Similar to Iraqis by 2 or more Vehicles in Household
In terms of 2 or more vehicles in household, the demographic groups most similar to Iraqis are Asian (57.0%, a difference of 0.16%), Immigrants from Jordan (57.2%, a difference of 0.19%), Native/Alaskan (57.0%, a difference of 0.19%), Chippewa (57.2%, a difference of 0.20%), and Costa Rican (56.9%, a difference of 0.24%).
| Demographics | Rating | Rank | 2 or more Vehicles in Household |
| Japanese | 98.0 /100 | #110 | Exceptional 57.5% |
| Greeks | 98.0 /100 | #111 | Exceptional 57.5% |
| Pueblo | 98.0 /100 | #112 | Exceptional 57.5% |
| Zimbabweans | 96.9 /100 | #113 | Exceptional 57.2% |
| Immigrants | Lebanon | 96.8 /100 | #114 | Exceptional 57.2% |
| Chippewa | 96.6 /100 | #115 | Exceptional 57.2% |
| Immigrants | Jordan | 96.6 /100 | #116 | Exceptional 57.2% |
| Iraqis | 95.8 /100 | #117 | Exceptional 57.1% |
| Asians | 95.1 /100 | #118 | Exceptional 57.0% |
| Natives/Alaskans | 95.0 /100 | #119 | Exceptional 57.0% |
| Costa Ricans | 94.7 /100 | #120 | Exceptional 56.9% |
| Sioux | 93.8 /100 | #121 | Exceptional 56.8% |
| Immigrants | South Africa | 92.5 /100 | #122 | Exceptional 56.7% |
| Australians | 91.8 /100 | #123 | Exceptional 56.7% |
| New Zealanders | 91.8 /100 | #124 | Exceptional 56.7% |
Demographics Similar to Croatians by 2 or more Vehicles in Household
In terms of 2 or more vehicles in household, the demographic groups most similar to Croatians are Immigrants from Central America (58.6%, a difference of 0.010%), Laotian (58.6%, a difference of 0.020%), Canadian (58.6%, a difference of 0.030%), Portuguese (58.6%, a difference of 0.060%), and Pennsylvania German (58.5%, a difference of 0.15%).
| Demographics | Rating | Rank | 2 or more Vehicles in Household |
| Spanish Americans | 99.8 /100 | #59 | Exceptional 58.9% |
| French Canadians | 99.8 /100 | #60 | Exceptional 58.9% |
| Osage | 99.8 /100 | #61 | Exceptional 58.8% |
| Immigrants | Nonimmigrants | 99.8 /100 | #62 | Exceptional 58.8% |
| Mexican American Indians | 99.8 /100 | #63 | Exceptional 58.7% |
| Portuguese | 99.7 /100 | #64 | Exceptional 58.6% |
| Immigrants | Central America | 99.7 /100 | #65 | Exceptional 58.6% |
| Croatians | 99.7 /100 | #66 | Exceptional 58.6% |
| Laotians | 99.7 /100 | #67 | Exceptional 58.6% |
| Canadians | 99.7 /100 | #68 | Exceptional 58.6% |
| Pennsylvania Germans | 99.7 /100 | #69 | Exceptional 58.5% |
| Italians | 99.6 /100 | #70 | Exceptional 58.4% |
| Bangladeshis | 99.6 /100 | #71 | Exceptional 58.4% |
| Austrians | 99.6 /100 | #72 | Exceptional 58.4% |
| Bolivians | 99.6 /100 | #73 | Exceptional 58.3% |