Immigrants from Latin America vs Immigrants from Western Asia 3 or more Vehicles in Household
COMPARE
Immigrants from Latin America
Immigrants from Western Asia
3 or more Vehicles in Household
3 or more Vehicles in Household Comparison
Immigrants from Latin America
Immigrants from Western Asia
20.5%
3 OR MORE VEHICLES IN HOUSEHOLD
94.5/ 100
METRIC RATING
119th/ 347
METRIC RANK
18.4%
3 OR MORE VEHICLES IN HOUSEHOLD
4.8/ 100
METRIC RATING
230th/ 347
METRIC RANK
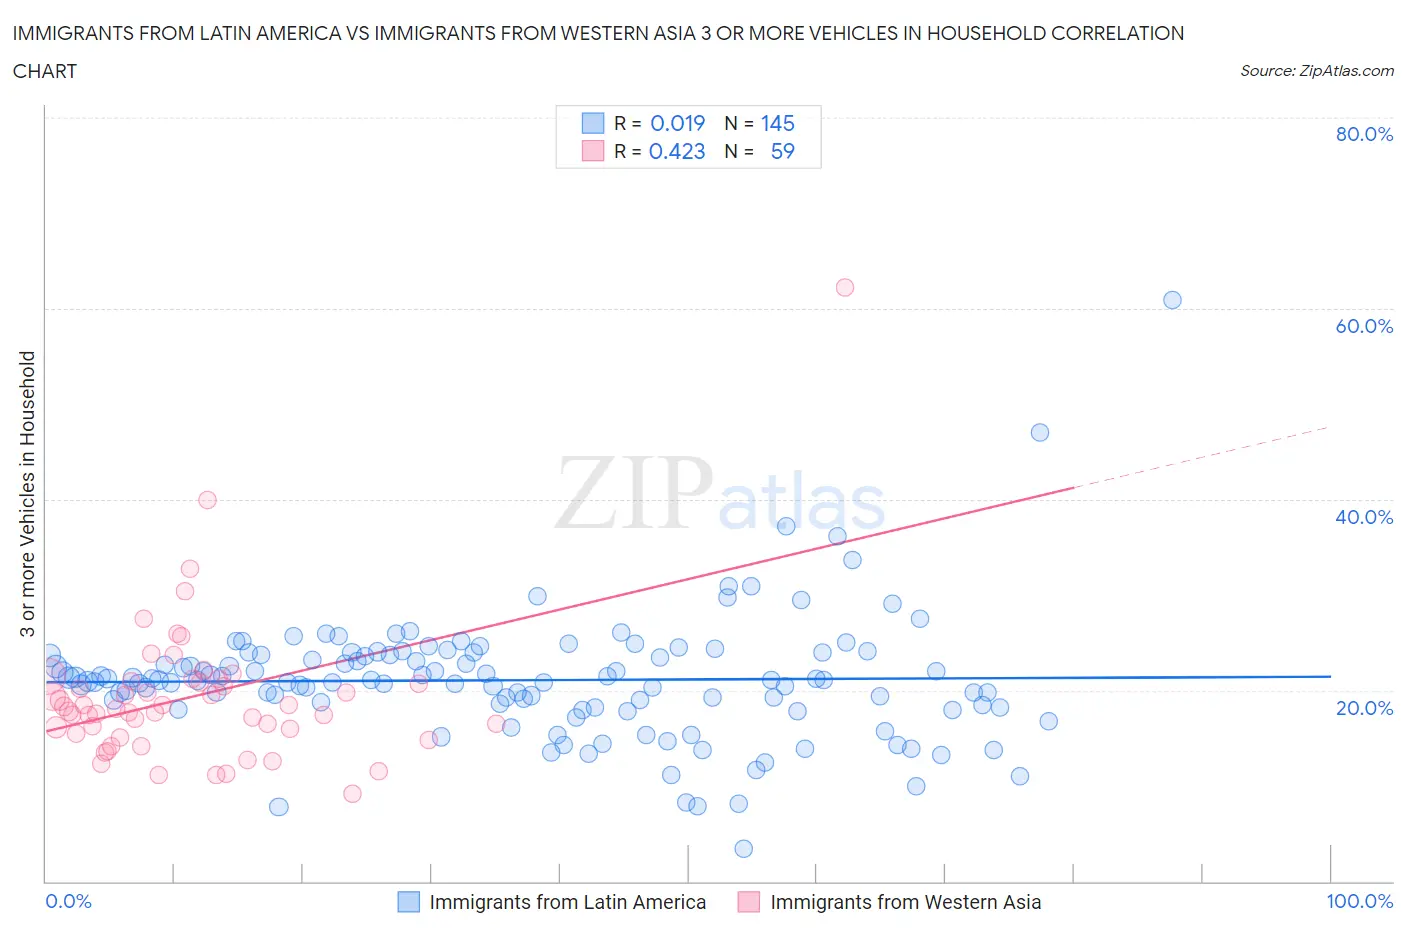
Immigrants from Latin America vs Immigrants from Western Asia 3 or more Vehicles in Household Correlation Chart
The statistical analysis conducted on geographies consisting of 557,725,170 people shows no correlation between the proportion of Immigrants from Latin America and percentage of households with 3 or more vehicles available in the United States with a correlation coefficient (R) of 0.019 and weighted average of 20.5%. Similarly, the statistical analysis conducted on geographies consisting of 404,016,930 people shows a moderate positive correlation between the proportion of Immigrants from Western Asia and percentage of households with 3 or more vehicles available in the United States with a correlation coefficient (R) of 0.423 and weighted average of 18.4%, a difference of 11.6%.
3 or more Vehicles in Household Correlation Summary
| Measurement | Immigrants from Latin America | Immigrants from Western Asia |
| Minimum | 3.4% | 9.2% |
| Maximum | 60.9% | 62.2% |
| Range | 57.5% | 52.9% |
| Mean | 21.1% | 19.4% |
| Median | 21.0% | 18.1% |
| Interquartile 25% (IQ1) | 18.3% | 15.4% |
| Interquartile 75% (IQ3) | 23.8% | 21.0% |
| Interquartile Range (IQR) | 5.5% | 5.6% |
| Standard Deviation (Sample) | 6.6% | 7.8% |
| Standard Deviation (Population) | 6.6% | 7.8% |
Similar Demographics by 3 or more Vehicles in Household
Demographics Similar to Immigrants from Latin America by 3 or more Vehicles in Household
In terms of 3 or more vehicles in household, the demographic groups most similar to Immigrants from Latin America are Costa Rican (20.6%, a difference of 0.040%), Croatian (20.6%, a difference of 0.15%), Italian (20.6%, a difference of 0.17%), Maltese (20.5%, a difference of 0.19%), and French Canadian (20.6%, a difference of 0.20%).
| Demographics | Rating | Rank | 3 or more Vehicles in Household |
| Nicaraguans | 96.2 /100 | #112 | Exceptional 20.7% |
| Immigrants | England | 96.2 /100 | #113 | Exceptional 20.7% |
| Burmese | 95.8 /100 | #114 | Exceptional 20.6% |
| French Canadians | 95.0 /100 | #115 | Exceptional 20.6% |
| Italians | 94.9 /100 | #116 | Exceptional 20.6% |
| Croatians | 94.9 /100 | #117 | Exceptional 20.6% |
| Costa Ricans | 94.6 /100 | #118 | Exceptional 20.6% |
| Immigrants | Latin America | 94.5 /100 | #119 | Exceptional 20.5% |
| Maltese | 93.9 /100 | #120 | Exceptional 20.5% |
| Immigrants | Thailand | 93.8 /100 | #121 | Exceptional 20.5% |
| German Russians | 93.7 /100 | #122 | Exceptional 20.5% |
| Immigrants | Korea | 93.7 /100 | #123 | Exceptional 20.5% |
| Central Americans | 93.1 /100 | #124 | Exceptional 20.5% |
| Immigrants | Netherlands | 92.9 /100 | #125 | Exceptional 20.4% |
| Slavs | 92.1 /100 | #126 | Exceptional 20.4% |
Demographics Similar to Immigrants from Western Asia by 3 or more Vehicles in Household
In terms of 3 or more vehicles in household, the demographic groups most similar to Immigrants from Western Asia are Immigrants from Belgium (18.4%, a difference of 0.030%), Immigrants from Switzerland (18.4%, a difference of 0.060%), Immigrants from Uganda (18.4%, a difference of 0.090%), Honduran (18.4%, a difference of 0.11%), and Immigrants from North Macedonia (18.4%, a difference of 0.17%).
| Demographics | Rating | Rank | 3 or more Vehicles in Household |
| Immigrants | Czechoslovakia | 5.9 /100 | #223 | Tragic 18.5% |
| Immigrants | Argentina | 5.6 /100 | #224 | Tragic 18.5% |
| Immigrants | Lithuania | 5.6 /100 | #225 | Tragic 18.5% |
| Immigrants | Hungary | 5.5 /100 | #226 | Tragic 18.5% |
| Immigrants | Singapore | 5.4 /100 | #227 | Tragic 18.4% |
| Turks | 5.4 /100 | #228 | Tragic 18.4% |
| Immigrants | Switzerland | 5.0 /100 | #229 | Tragic 18.4% |
| Immigrants | Western Asia | 4.8 /100 | #230 | Tragic 18.4% |
| Immigrants | Belgium | 4.8 /100 | #231 | Tragic 18.4% |
| Immigrants | Uganda | 4.6 /100 | #232 | Tragic 18.4% |
| Hondurans | 4.6 /100 | #233 | Tragic 18.4% |
| Immigrants | North Macedonia | 4.4 /100 | #234 | Tragic 18.4% |
| Sierra Leoneans | 3.9 /100 | #235 | Tragic 18.3% |
| Immigrants | Malaysia | 3.6 /100 | #236 | Tragic 18.3% |
| Indonesians | 3.5 /100 | #237 | Tragic 18.3% |