Immigrants from Latin America vs Immigrants from India 3 or more Vehicles in Household
COMPARE
Immigrants from Latin America
Immigrants from India
3 or more Vehicles in Household
3 or more Vehicles in Household Comparison
Immigrants from Latin America
Immigrants from India
20.5%
3 OR MORE VEHICLES IN HOUSEHOLD
94.5/ 100
METRIC RATING
119th/ 347
METRIC RANK
20.2%
3 OR MORE VEHICLES IN HOUSEHOLD
87.2/ 100
METRIC RATING
135th/ 347
METRIC RANK
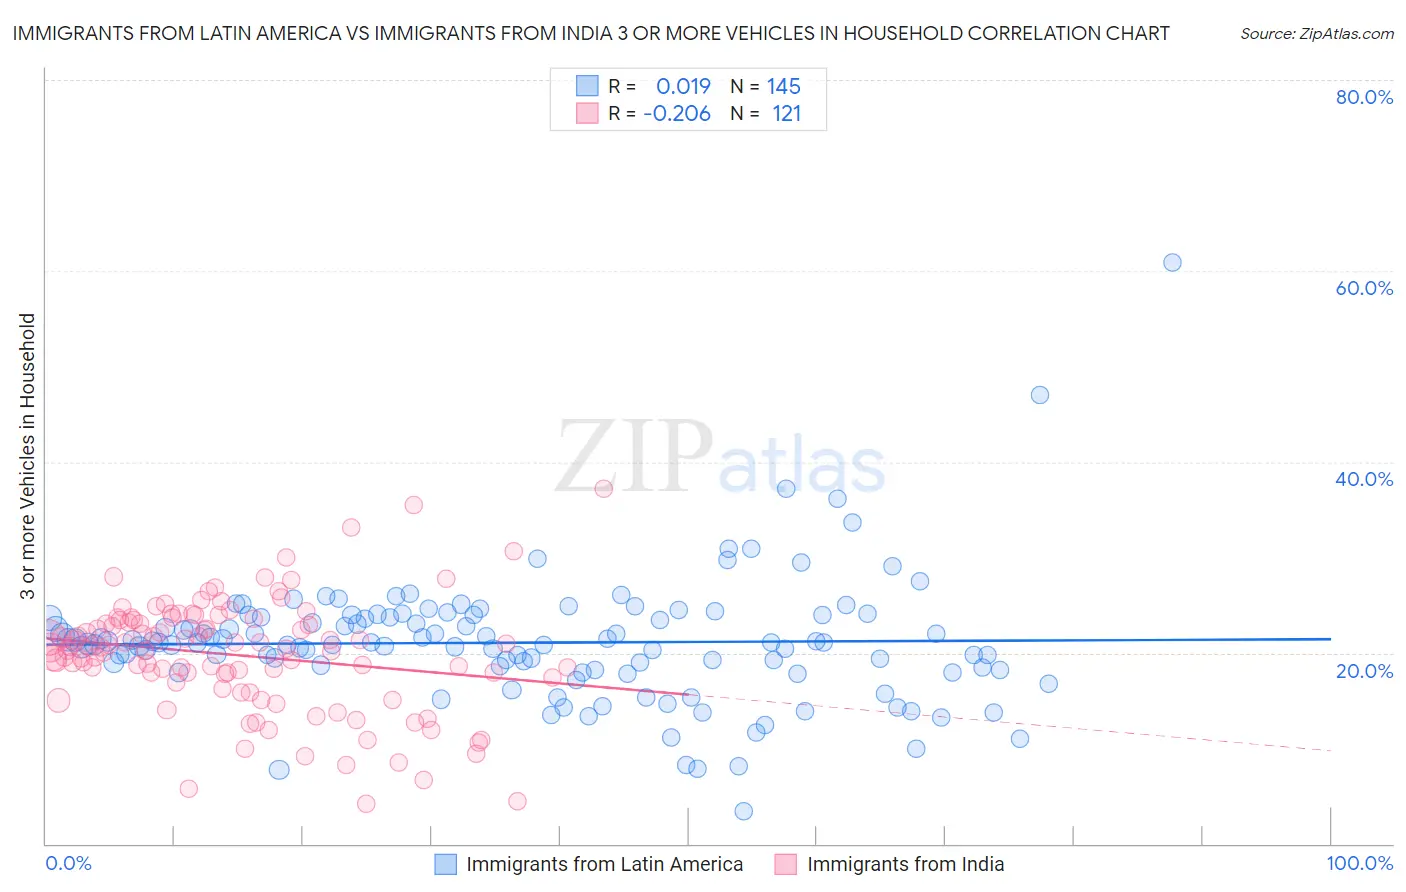
Immigrants from Latin America vs Immigrants from India 3 or more Vehicles in Household Correlation Chart
The statistical analysis conducted on geographies consisting of 557,725,170 people shows no correlation between the proportion of Immigrants from Latin America and percentage of households with 3 or more vehicles available in the United States with a correlation coefficient (R) of 0.019 and weighted average of 20.5%. Similarly, the statistical analysis conducted on geographies consisting of 433,547,679 people shows a weak negative correlation between the proportion of Immigrants from India and percentage of households with 3 or more vehicles available in the United States with a correlation coefficient (R) of -0.206 and weighted average of 20.2%, a difference of 1.7%.
3 or more Vehicles in Household Correlation Summary
| Measurement | Immigrants from Latin America | Immigrants from India |
| Minimum | 3.4% | 4.1% |
| Maximum | 60.9% | 37.1% |
| Range | 57.5% | 33.0% |
| Mean | 21.1% | 19.8% |
| Median | 21.0% | 20.5% |
| Interquartile 25% (IQ1) | 18.3% | 17.2% |
| Interquartile 75% (IQ3) | 23.8% | 23.4% |
| Interquartile Range (IQR) | 5.5% | 6.2% |
| Standard Deviation (Sample) | 6.6% | 5.9% |
| Standard Deviation (Population) | 6.6% | 5.9% |
Demographics Similar to Immigrants from Latin America and Immigrants from India by 3 or more Vehicles in Household
In terms of 3 or more vehicles in household, the demographic groups most similar to Immigrants from Latin America are Costa Rican (20.6%, a difference of 0.040%), Croatian (20.6%, a difference of 0.15%), Maltese (20.5%, a difference of 0.19%), Immigrants from Thailand (20.5%, a difference of 0.21%), and German Russian (20.5%, a difference of 0.25%). Similarly, the demographic groups most similar to Immigrants from India are Immigrants from Nicaragua (20.2%, a difference of 0.010%), Immigrants from Iraq (20.2%, a difference of 0.010%), Polish (20.2%, a difference of 0.020%), Immigrants from Canada (20.2%, a difference of 0.11%), and Immigrants from North America (20.2%, a difference of 0.11%).
| Demographics | Rating | Rank | 3 or more Vehicles in Household |
| Croatians | 94.9 /100 | #117 | Exceptional 20.6% |
| Costa Ricans | 94.6 /100 | #118 | Exceptional 20.6% |
| Immigrants | Latin America | 94.5 /100 | #119 | Exceptional 20.5% |
| Maltese | 93.9 /100 | #120 | Exceptional 20.5% |
| Immigrants | Thailand | 93.8 /100 | #121 | Exceptional 20.5% |
| German Russians | 93.7 /100 | #122 | Exceptional 20.5% |
| Immigrants | Korea | 93.7 /100 | #123 | Exceptional 20.5% |
| Central Americans | 93.1 /100 | #124 | Exceptional 20.5% |
| Immigrants | Netherlands | 92.9 /100 | #125 | Exceptional 20.4% |
| Slavs | 92.1 /100 | #126 | Exceptional 20.4% |
| Immigrants | Bolivia | 92.0 /100 | #127 | Exceptional 20.4% |
| New Zealanders | 91.3 /100 | #128 | Exceptional 20.4% |
| Zimbabweans | 88.7 /100 | #129 | Excellent 20.3% |
| Greeks | 88.6 /100 | #130 | Excellent 20.3% |
| Immigrants | Asia | 88.1 /100 | #131 | Excellent 20.2% |
| Immigrants | Canada | 87.8 /100 | #132 | Excellent 20.2% |
| Immigrants | North America | 87.8 /100 | #133 | Excellent 20.2% |
| Poles | 87.3 /100 | #134 | Excellent 20.2% |
| Immigrants | India | 87.2 /100 | #135 | Excellent 20.2% |
| Immigrants | Nicaragua | 87.1 /100 | #136 | Excellent 20.2% |
| Immigrants | Iraq | 87.1 /100 | #137 | Excellent 20.2% |