Polish vs Immigrants from Western Asia 3 or more Vehicles in Household
COMPARE
Polish
Immigrants from Western Asia
3 or more Vehicles in Household
3 or more Vehicles in Household Comparison
Poles
Immigrants from Western Asia
20.2%
3 OR MORE VEHICLES IN HOUSEHOLD
87.3/ 100
METRIC RATING
134th/ 347
METRIC RANK
18.4%
3 OR MORE VEHICLES IN HOUSEHOLD
4.8/ 100
METRIC RATING
230th/ 347
METRIC RANK
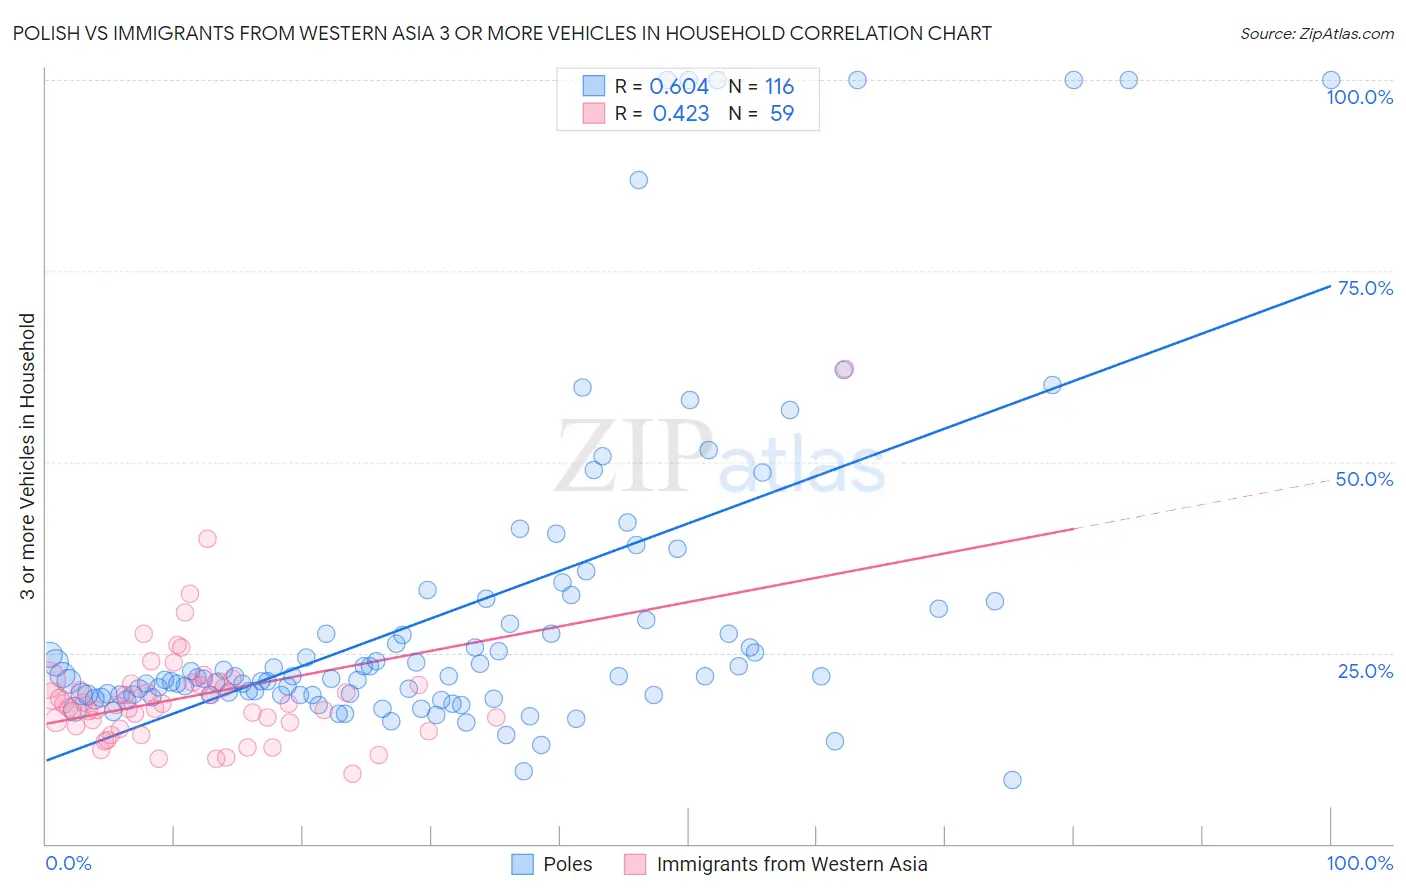
Polish vs Immigrants from Western Asia 3 or more Vehicles in Household Correlation Chart
The statistical analysis conducted on geographies consisting of 559,689,592 people shows a significant positive correlation between the proportion of Poles and percentage of households with 3 or more vehicles available in the United States with a correlation coefficient (R) of 0.604 and weighted average of 20.2%. Similarly, the statistical analysis conducted on geographies consisting of 404,016,930 people shows a moderate positive correlation between the proportion of Immigrants from Western Asia and percentage of households with 3 or more vehicles available in the United States with a correlation coefficient (R) of 0.423 and weighted average of 18.4%, a difference of 9.8%.
3 or more Vehicles in Household Correlation Summary
| Measurement | Polish | Immigrants from Western Asia |
| Minimum | 8.4% | 9.2% |
| Maximum | 100.0% | 62.2% |
| Range | 91.6% | 52.9% |
| Mean | 30.3% | 19.4% |
| Median | 21.9% | 18.1% |
| Interquartile 25% (IQ1) | 19.5% | 15.4% |
| Interquartile 75% (IQ3) | 30.0% | 21.0% |
| Interquartile Range (IQR) | 10.6% | 5.6% |
| Standard Deviation (Sample) | 21.4% | 7.8% |
| Standard Deviation (Population) | 21.3% | 7.8% |
Similar Demographics by 3 or more Vehicles in Household
Demographics Similar to Poles by 3 or more Vehicles in Household
In terms of 3 or more vehicles in household, the demographic groups most similar to Poles are Immigrants from India (20.2%, a difference of 0.020%), Immigrants from Nicaragua (20.2%, a difference of 0.030%), Immigrants from Iraq (20.2%, a difference of 0.040%), Immigrants from Canada (20.2%, a difference of 0.090%), and Immigrants from North America (20.2%, a difference of 0.090%).
| Demographics | Rating | Rank | 3 or more Vehicles in Household |
| Immigrants | Bolivia | 92.0 /100 | #127 | Exceptional 20.4% |
| New Zealanders | 91.3 /100 | #128 | Exceptional 20.4% |
| Zimbabweans | 88.7 /100 | #129 | Excellent 20.3% |
| Greeks | 88.6 /100 | #130 | Excellent 20.3% |
| Immigrants | Asia | 88.1 /100 | #131 | Excellent 20.2% |
| Immigrants | Canada | 87.8 /100 | #132 | Excellent 20.2% |
| Immigrants | North America | 87.8 /100 | #133 | Excellent 20.2% |
| Poles | 87.3 /100 | #134 | Excellent 20.2% |
| Immigrants | India | 87.2 /100 | #135 | Excellent 20.2% |
| Immigrants | Nicaragua | 87.1 /100 | #136 | Excellent 20.2% |
| Immigrants | Iraq | 87.1 /100 | #137 | Excellent 20.2% |
| Aleuts | 86.3 /100 | #138 | Excellent 20.2% |
| Slovenes | 85.5 /100 | #139 | Excellent 20.2% |
| French American Indians | 85.3 /100 | #140 | Excellent 20.1% |
| Ottawa | 84.9 /100 | #141 | Excellent 20.1% |
Demographics Similar to Immigrants from Western Asia by 3 or more Vehicles in Household
In terms of 3 or more vehicles in household, the demographic groups most similar to Immigrants from Western Asia are Immigrants from Belgium (18.4%, a difference of 0.030%), Immigrants from Switzerland (18.4%, a difference of 0.060%), Immigrants from Uganda (18.4%, a difference of 0.090%), Honduran (18.4%, a difference of 0.11%), and Immigrants from North Macedonia (18.4%, a difference of 0.17%).
| Demographics | Rating | Rank | 3 or more Vehicles in Household |
| Immigrants | Czechoslovakia | 5.9 /100 | #223 | Tragic 18.5% |
| Immigrants | Argentina | 5.6 /100 | #224 | Tragic 18.5% |
| Immigrants | Lithuania | 5.6 /100 | #225 | Tragic 18.5% |
| Immigrants | Hungary | 5.5 /100 | #226 | Tragic 18.5% |
| Immigrants | Singapore | 5.4 /100 | #227 | Tragic 18.4% |
| Turks | 5.4 /100 | #228 | Tragic 18.4% |
| Immigrants | Switzerland | 5.0 /100 | #229 | Tragic 18.4% |
| Immigrants | Western Asia | 4.8 /100 | #230 | Tragic 18.4% |
| Immigrants | Belgium | 4.8 /100 | #231 | Tragic 18.4% |
| Immigrants | Uganda | 4.6 /100 | #232 | Tragic 18.4% |
| Hondurans | 4.6 /100 | #233 | Tragic 18.4% |
| Immigrants | North Macedonia | 4.4 /100 | #234 | Tragic 18.4% |
| Sierra Leoneans | 3.9 /100 | #235 | Tragic 18.3% |
| Immigrants | Malaysia | 3.6 /100 | #236 | Tragic 18.3% |
| Indonesians | 3.5 /100 | #237 | Tragic 18.3% |