Immigrants from Latin America vs Immigrants from Western Asia Poverty
COMPARE
Immigrants from Latin America
Immigrants from Western Asia
Poverty
Poverty Comparison
Immigrants from Latin America
Immigrants from Western Asia
15.0%
POVERTY
0.0/ 100
METRIC RATING
286th/ 347
METRIC RANK
12.9%
POVERTY
14.1/ 100
METRIC RATING
204th/ 347
METRIC RANK
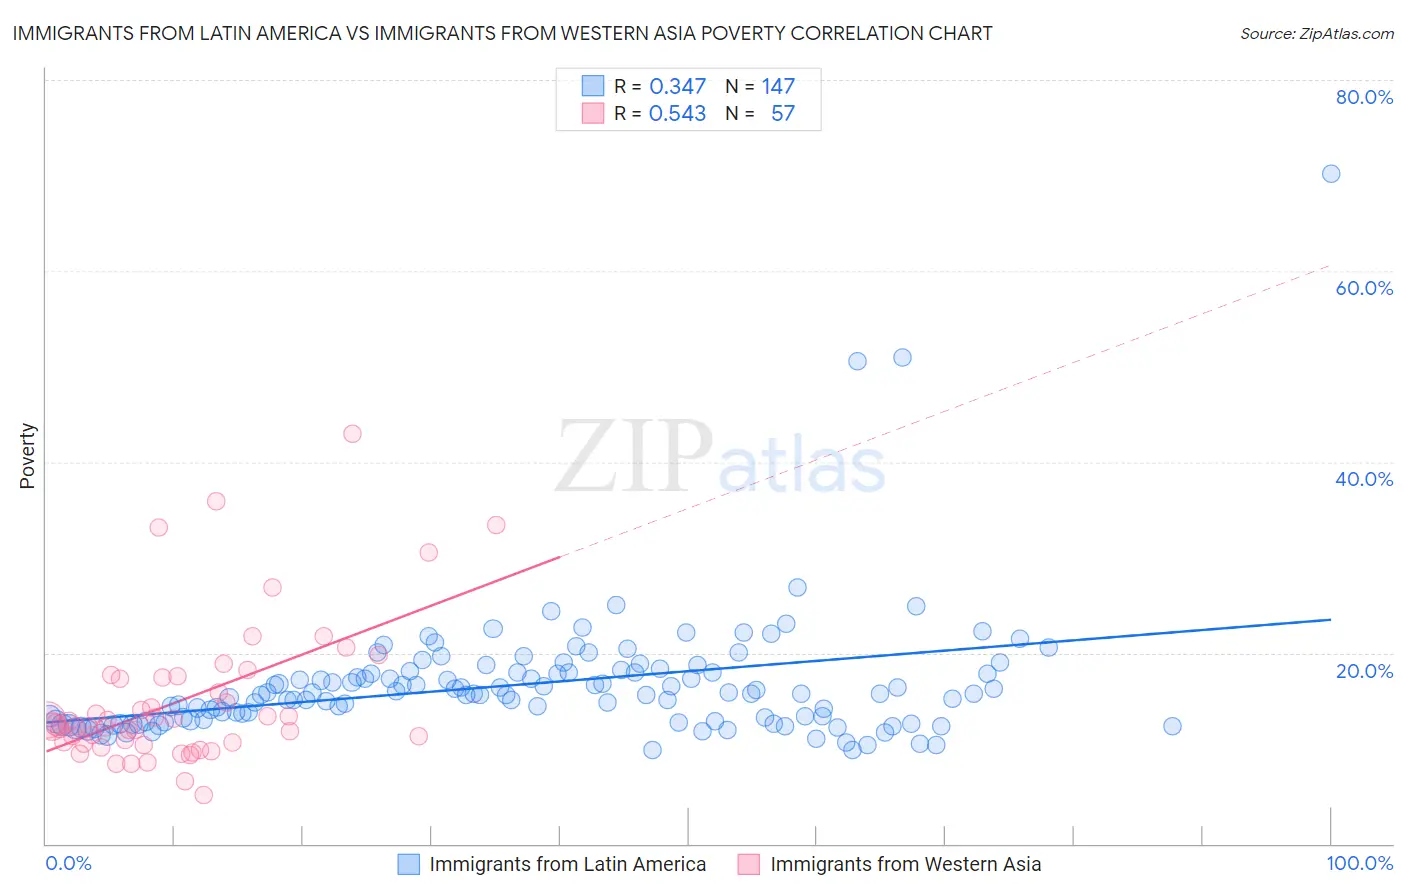
Immigrants from Latin America vs Immigrants from Western Asia Poverty Correlation Chart
The statistical analysis conducted on geographies consisting of 557,920,338 people shows a mild positive correlation between the proportion of Immigrants from Latin America and poverty level in the United States with a correlation coefficient (R) of 0.347 and weighted average of 15.0%. Similarly, the statistical analysis conducted on geographies consisting of 404,214,361 people shows a substantial positive correlation between the proportion of Immigrants from Western Asia and poverty level in the United States with a correlation coefficient (R) of 0.543 and weighted average of 12.9%, a difference of 16.9%.
Poverty Correlation Summary
| Measurement | Immigrants from Latin America | Immigrants from Western Asia |
| Minimum | 9.8% | 5.2% |
| Maximum | 70.2% | 42.9% |
| Range | 60.4% | 37.7% |
| Mean | 16.7% | 15.1% |
| Median | 15.7% | 12.5% |
| Interquartile 25% (IQ1) | 12.9% | 10.5% |
| Interquartile 75% (IQ3) | 17.9% | 17.5% |
| Interquartile Range (IQR) | 5.0% | 7.0% |
| Standard Deviation (Sample) | 6.9% | 7.6% |
| Standard Deviation (Population) | 6.9% | 7.5% |
Similar Demographics by Poverty
Demographics Similar to Immigrants from Latin America by Poverty
In terms of poverty, the demographic groups most similar to Immigrants from Latin America are Inupiat (15.1%, a difference of 0.21%), Yaqui (15.1%, a difference of 0.22%), Vietnamese (15.0%, a difference of 0.26%), West Indian (15.0%, a difference of 0.32%), and Immigrants from Belize (15.1%, a difference of 0.34%).
| Demographics | Rating | Rank | Poverty |
| Immigrants | St. Vincent and the Grenadines | 0.0 /100 | #279 | Tragic 14.9% |
| Haitians | 0.0 /100 | #280 | Tragic 14.9% |
| Immigrants | Barbados | 0.0 /100 | #281 | Tragic 14.9% |
| Comanche | 0.0 /100 | #282 | Tragic 15.0% |
| Immigrants | Haiti | 0.0 /100 | #283 | Tragic 15.0% |
| West Indians | 0.0 /100 | #284 | Tragic 15.0% |
| Vietnamese | 0.0 /100 | #285 | Tragic 15.0% |
| Immigrants | Latin America | 0.0 /100 | #286 | Tragic 15.0% |
| Inupiat | 0.0 /100 | #287 | Tragic 15.1% |
| Yaqui | 0.0 /100 | #288 | Tragic 15.1% |
| Immigrants | Belize | 0.0 /100 | #289 | Tragic 15.1% |
| Mexicans | 0.0 /100 | #290 | Tragic 15.1% |
| Immigrants | Cabo Verde | 0.0 /100 | #291 | Tragic 15.1% |
| Indonesians | 0.0 /100 | #292 | Tragic 15.1% |
| Immigrants | Zaire | 0.0 /100 | #293 | Tragic 15.1% |
Demographics Similar to Immigrants from Western Asia by Poverty
In terms of poverty, the demographic groups most similar to Immigrants from Western Asia are Hmong (12.8%, a difference of 0.16%), Immigrants from Uruguay (12.8%, a difference of 0.26%), Spaniard (12.8%, a difference of 0.43%), Immigrants from Uganda (12.8%, a difference of 0.43%), and Immigrants from Kenya (12.8%, a difference of 0.59%).
| Demographics | Rating | Rank | Poverty |
| Immigrants | Lebanon | 18.7 /100 | #197 | Poor 12.8% |
| Spanish | 18.7 /100 | #198 | Poor 12.8% |
| Immigrants | Kenya | 17.5 /100 | #199 | Poor 12.8% |
| Spaniards | 16.5 /100 | #200 | Poor 12.8% |
| Immigrants | Uganda | 16.5 /100 | #201 | Poor 12.8% |
| Immigrants | Uruguay | 15.6 /100 | #202 | Poor 12.8% |
| Hmong | 15.0 /100 | #203 | Poor 12.8% |
| Immigrants | Western Asia | 14.1 /100 | #204 | Poor 12.9% |
| Tsimshian | 9.2 /100 | #205 | Tragic 13.0% |
| Immigrants | Eastern Africa | 7.0 /100 | #206 | Tragic 13.1% |
| Panamanians | 6.6 /100 | #207 | Tragic 13.1% |
| Ugandans | 6.2 /100 | #208 | Tragic 13.1% |
| Malaysians | 6.1 /100 | #209 | Tragic 13.1% |
| Immigrants | Azores | 6.1 /100 | #210 | Tragic 13.1% |
| Moroccans | 5.2 /100 | #211 | Tragic 13.2% |