Immigrants from Latin America vs Native Hawaiian 3 or more Vehicles in Household
COMPARE
Immigrants from Latin America
Native Hawaiian
3 or more Vehicles in Household
3 or more Vehicles in Household Comparison
Immigrants from Latin America
Native Hawaiians
20.5%
3 OR MORE VEHICLES IN HOUSEHOLD
94.5/ 100
METRIC RATING
119th/ 347
METRIC RANK
24.9%
3 OR MORE VEHICLES IN HOUSEHOLD
100.0/ 100
METRIC RATING
9th/ 347
METRIC RANK
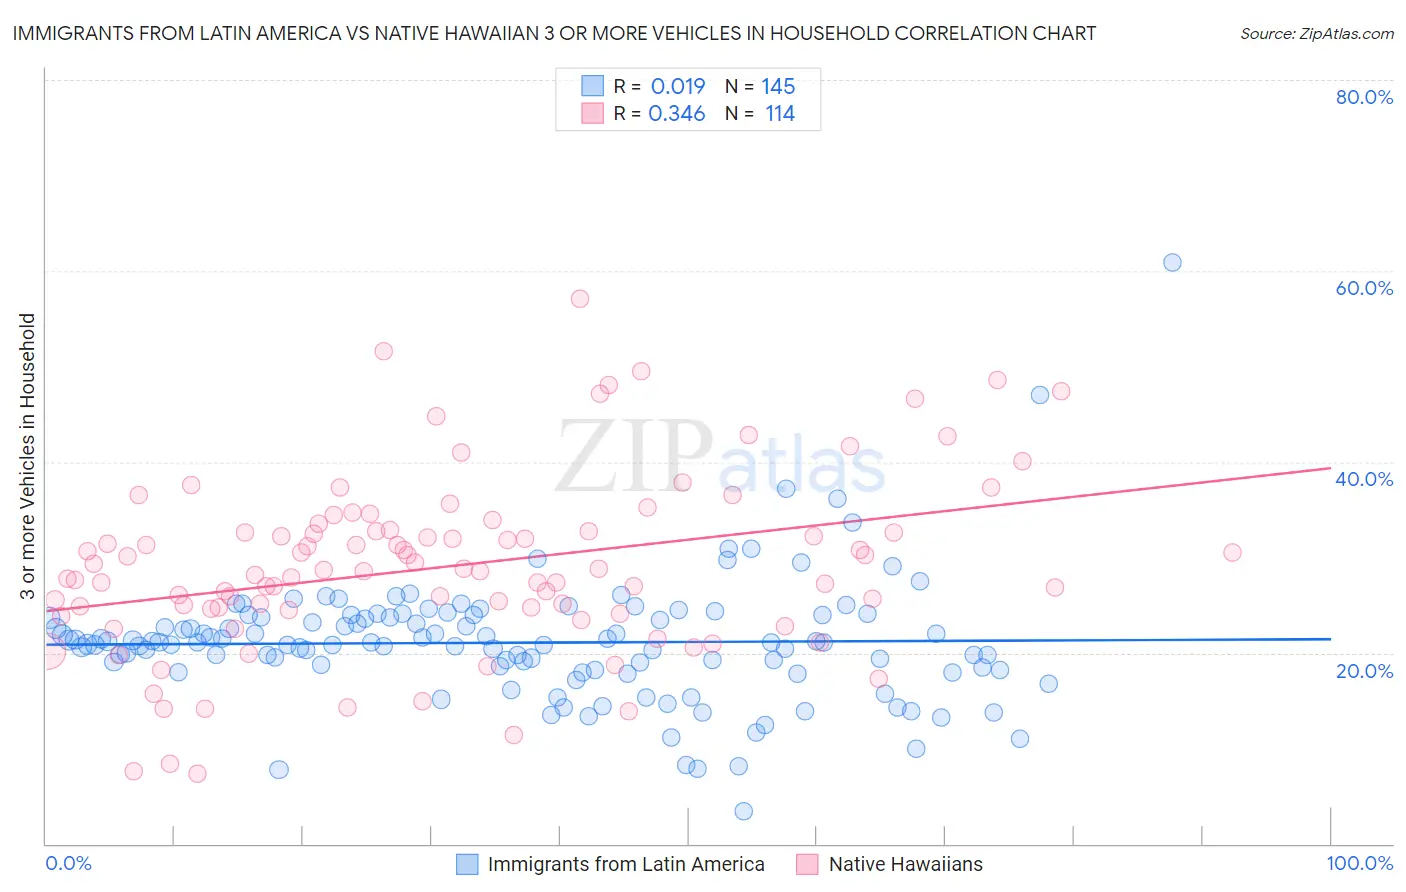
Immigrants from Latin America vs Native Hawaiian 3 or more Vehicles in Household Correlation Chart
The statistical analysis conducted on geographies consisting of 557,725,170 people shows no correlation between the proportion of Immigrants from Latin America and percentage of households with 3 or more vehicles available in the United States with a correlation coefficient (R) of 0.019 and weighted average of 20.5%. Similarly, the statistical analysis conducted on geographies consisting of 331,830,986 people shows a mild positive correlation between the proportion of Native Hawaiians and percentage of households with 3 or more vehicles available in the United States with a correlation coefficient (R) of 0.346 and weighted average of 24.9%, a difference of 21.4%.
3 or more Vehicles in Household Correlation Summary
| Measurement | Immigrants from Latin America | Native Hawaiian |
| Minimum | 3.4% | 7.3% |
| Maximum | 60.9% | 57.1% |
| Range | 57.5% | 49.8% |
| Mean | 21.1% | 29.1% |
| Median | 21.0% | 28.7% |
| Interquartile 25% (IQ1) | 18.3% | 24.6% |
| Interquartile 75% (IQ3) | 23.8% | 32.8% |
| Interquartile Range (IQR) | 5.5% | 8.2% |
| Standard Deviation (Sample) | 6.6% | 9.2% |
| Standard Deviation (Population) | 6.6% | 9.2% |
Similar Demographics by 3 or more Vehicles in Household
Demographics Similar to Immigrants from Latin America by 3 or more Vehicles in Household
In terms of 3 or more vehicles in household, the demographic groups most similar to Immigrants from Latin America are Costa Rican (20.6%, a difference of 0.040%), Croatian (20.6%, a difference of 0.15%), Italian (20.6%, a difference of 0.17%), Maltese (20.5%, a difference of 0.19%), and French Canadian (20.6%, a difference of 0.20%).
| Demographics | Rating | Rank | 3 or more Vehicles in Household |
| Nicaraguans | 96.2 /100 | #112 | Exceptional 20.7% |
| Immigrants | England | 96.2 /100 | #113 | Exceptional 20.7% |
| Burmese | 95.8 /100 | #114 | Exceptional 20.6% |
| French Canadians | 95.0 /100 | #115 | Exceptional 20.6% |
| Italians | 94.9 /100 | #116 | Exceptional 20.6% |
| Croatians | 94.9 /100 | #117 | Exceptional 20.6% |
| Costa Ricans | 94.6 /100 | #118 | Exceptional 20.6% |
| Immigrants | Latin America | 94.5 /100 | #119 | Exceptional 20.5% |
| Maltese | 93.9 /100 | #120 | Exceptional 20.5% |
| Immigrants | Thailand | 93.8 /100 | #121 | Exceptional 20.5% |
| German Russians | 93.7 /100 | #122 | Exceptional 20.5% |
| Immigrants | Korea | 93.7 /100 | #123 | Exceptional 20.5% |
| Central Americans | 93.1 /100 | #124 | Exceptional 20.5% |
| Immigrants | Netherlands | 92.9 /100 | #125 | Exceptional 20.4% |
| Slavs | 92.1 /100 | #126 | Exceptional 20.4% |
Demographics Similar to Native Hawaiians by 3 or more Vehicles in Household
In terms of 3 or more vehicles in household, the demographic groups most similar to Native Hawaiians are Nepalese (24.9%, a difference of 0.090%), Samoan (25.0%, a difference of 0.10%), Shoshone (24.9%, a difference of 0.19%), Danish (24.7%, a difference of 0.88%), and Mexican (24.7%, a difference of 0.96%).
| Demographics | Rating | Rank | 3 or more Vehicles in Household |
| Spanish American Indians | 100.0 /100 | #2 | Exceptional 26.9% |
| Tongans | 100.0 /100 | #3 | Exceptional 26.5% |
| Arapaho | 100.0 /100 | #4 | Exceptional 26.4% |
| Puget Sound Salish | 100.0 /100 | #5 | Exceptional 26.4% |
| Immigrants | Fiji | 100.0 /100 | #6 | Exceptional 26.1% |
| Colville | 100.0 /100 | #7 | Exceptional 25.8% |
| Samoans | 100.0 /100 | #8 | Exceptional 25.0% |
| Native Hawaiians | 100.0 /100 | #9 | Exceptional 24.9% |
| Nepalese | 100.0 /100 | #10 | Exceptional 24.9% |
| Shoshone | 100.0 /100 | #11 | Exceptional 24.9% |
| Danes | 100.0 /100 | #12 | Exceptional 24.7% |
| Mexicans | 100.0 /100 | #13 | Exceptional 24.7% |
| Immigrants | Mexico | 100.0 /100 | #14 | Exceptional 24.6% |
| Hawaiians | 100.0 /100 | #15 | Exceptional 24.3% |
| Basques | 100.0 /100 | #16 | Exceptional 24.3% |