Northern European vs Immigrants from Western Asia 3 or more Vehicles in Household
COMPARE
Northern European
Immigrants from Western Asia
3 or more Vehicles in Household
3 or more Vehicles in Household Comparison
Northern Europeans
Immigrants from Western Asia
22.0%
3 OR MORE VEHICLES IN HOUSEHOLD
99.9/ 100
METRIC RATING
66th/ 347
METRIC RANK
18.4%
3 OR MORE VEHICLES IN HOUSEHOLD
4.8/ 100
METRIC RATING
230th/ 347
METRIC RANK
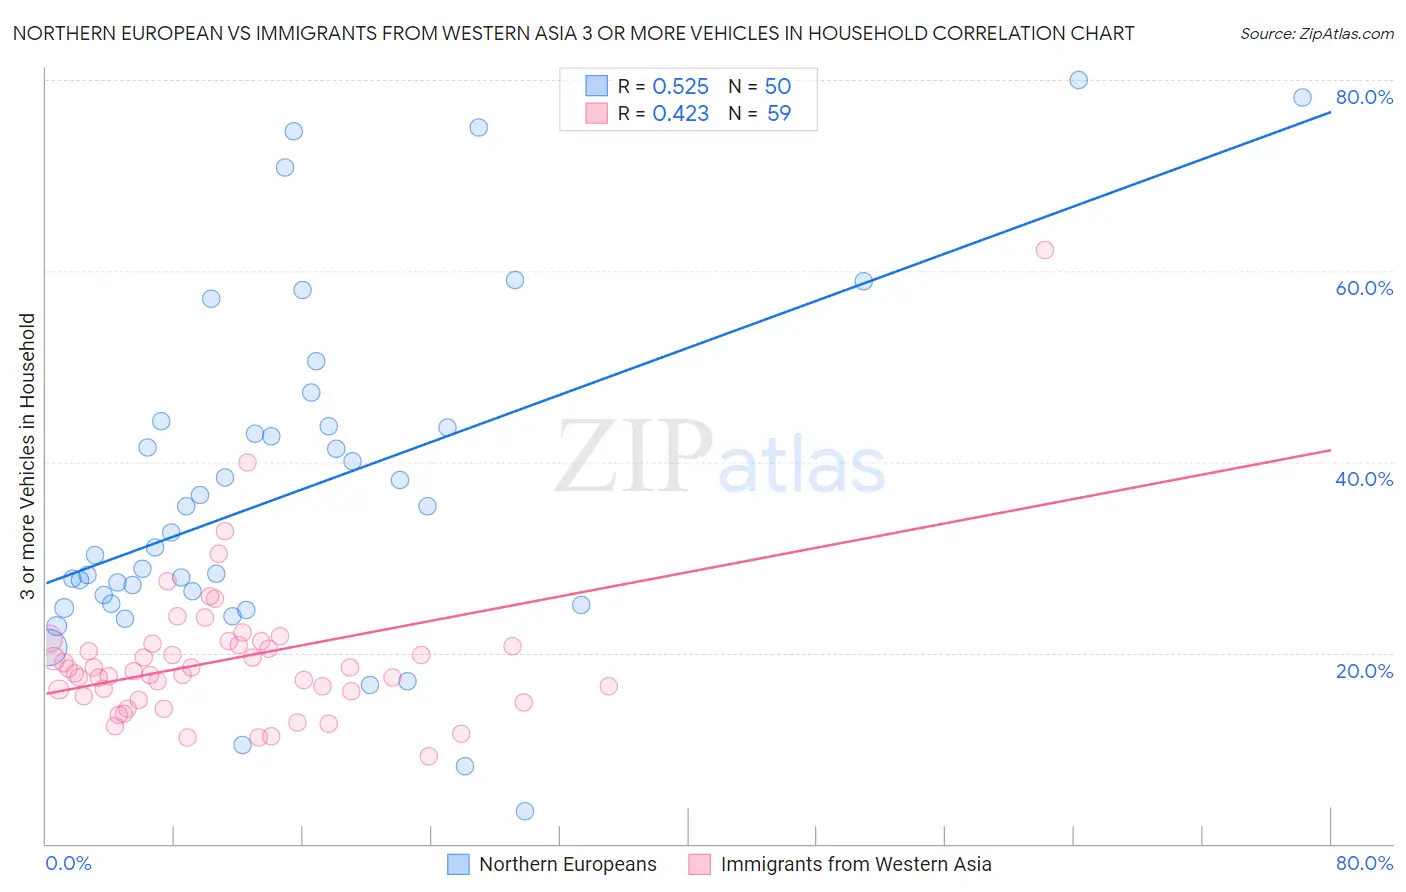
Northern European vs Immigrants from Western Asia 3 or more Vehicles in Household Correlation Chart
The statistical analysis conducted on geographies consisting of 405,855,528 people shows a substantial positive correlation between the proportion of Northern Europeans and percentage of households with 3 or more vehicles available in the United States with a correlation coefficient (R) of 0.525 and weighted average of 22.0%. Similarly, the statistical analysis conducted on geographies consisting of 404,016,930 people shows a moderate positive correlation between the proportion of Immigrants from Western Asia and percentage of households with 3 or more vehicles available in the United States with a correlation coefficient (R) of 0.423 and weighted average of 18.4%, a difference of 19.6%.
3 or more Vehicles in Household Correlation Summary
| Measurement | Northern European | Immigrants from Western Asia |
| Minimum | 3.4% | 9.2% |
| Maximum | 80.0% | 62.2% |
| Range | 76.6% | 52.9% |
| Mean | 37.0% | 19.4% |
| Median | 31.9% | 18.1% |
| Interquartile 25% (IQ1) | 25.2% | 15.4% |
| Interquartile 75% (IQ3) | 43.8% | 21.0% |
| Interquartile Range (IQR) | 18.6% | 5.6% |
| Standard Deviation (Sample) | 18.0% | 7.8% |
| Standard Deviation (Population) | 17.8% | 7.8% |
Similar Demographics by 3 or more Vehicles in Household
Demographics Similar to Northern Europeans by 3 or more Vehicles in Household
In terms of 3 or more vehicles in household, the demographic groups most similar to Northern Europeans are Pima (22.0%, a difference of 0.14%), Alaskan Athabascan (21.9%, a difference of 0.26%), British (21.9%, a difference of 0.41%), Creek (21.9%, a difference of 0.43%), and Immigrants from Taiwan (22.1%, a difference of 0.56%).
| Demographics | Rating | Rank | 3 or more Vehicles in Household |
| Navajo | 100.0 /100 | #59 | Exceptional 22.3% |
| Finns | 99.9 /100 | #60 | Exceptional 22.3% |
| Bhutanese | 99.9 /100 | #61 | Exceptional 22.2% |
| Fijians | 99.9 /100 | #62 | Exceptional 22.2% |
| Chickasaw | 99.9 /100 | #63 | Exceptional 22.2% |
| Immigrants | Taiwan | 99.9 /100 | #64 | Exceptional 22.1% |
| Pima | 99.9 /100 | #65 | Exceptional 22.0% |
| Northern Europeans | 99.9 /100 | #66 | Exceptional 22.0% |
| Alaskan Athabascans | 99.9 /100 | #67 | Exceptional 21.9% |
| British | 99.9 /100 | #68 | Exceptional 21.9% |
| Creek | 99.9 /100 | #69 | Exceptional 21.9% |
| Bangladeshis | 99.8 /100 | #70 | Exceptional 21.9% |
| Potawatomi | 99.8 /100 | #71 | Exceptional 21.9% |
| Portuguese | 99.8 /100 | #72 | Exceptional 21.8% |
| Salvadorans | 99.8 /100 | #73 | Exceptional 21.8% |
Demographics Similar to Immigrants from Western Asia by 3 or more Vehicles in Household
In terms of 3 or more vehicles in household, the demographic groups most similar to Immigrants from Western Asia are Immigrants from Belgium (18.4%, a difference of 0.030%), Immigrants from Switzerland (18.4%, a difference of 0.060%), Immigrants from Uganda (18.4%, a difference of 0.090%), Honduran (18.4%, a difference of 0.11%), and Immigrants from North Macedonia (18.4%, a difference of 0.17%).
| Demographics | Rating | Rank | 3 or more Vehicles in Household |
| Immigrants | Czechoslovakia | 5.9 /100 | #223 | Tragic 18.5% |
| Immigrants | Argentina | 5.6 /100 | #224 | Tragic 18.5% |
| Immigrants | Lithuania | 5.6 /100 | #225 | Tragic 18.5% |
| Immigrants | Hungary | 5.5 /100 | #226 | Tragic 18.5% |
| Immigrants | Singapore | 5.4 /100 | #227 | Tragic 18.4% |
| Turks | 5.4 /100 | #228 | Tragic 18.4% |
| Immigrants | Switzerland | 5.0 /100 | #229 | Tragic 18.4% |
| Immigrants | Western Asia | 4.8 /100 | #230 | Tragic 18.4% |
| Immigrants | Belgium | 4.8 /100 | #231 | Tragic 18.4% |
| Immigrants | Uganda | 4.6 /100 | #232 | Tragic 18.4% |
| Hondurans | 4.6 /100 | #233 | Tragic 18.4% |
| Immigrants | North Macedonia | 4.4 /100 | #234 | Tragic 18.4% |
| Sierra Leoneans | 3.9 /100 | #235 | Tragic 18.3% |
| Immigrants | Malaysia | 3.6 /100 | #236 | Tragic 18.3% |
| Indonesians | 3.5 /100 | #237 | Tragic 18.3% |